
Search Results for: methane
Methane Deathtrap Threatens Democracy


Source: Counterpunch.org
A methane deathtrap – continuing Arctic Ocean eruption of ever-increasing levels of methane brings forth speculation of a “Black Swan Event,” meaning society is caught flat-footed oblivious to impending danger until it’s way too late.
Along those lines, The Economist newspaper only recently highlighted the methane issue for its mainstream readership. “The Methane Mystery: Scientists Struggle to Explain a Worrying Rise in Atmospheric Methane,” The Economist, April 28th 2018: “Keeping methane in check is therefore critical if a rise in temperature this century is to remain ‘well below’ 2°C relative to pre-industrial times, a goal set out in the Paris climate agreement of 2015… The explanations put forward by scientists range from the troubling to the truly hair-raising.” (Ed.-“Hair-raising” 100% correct.)
Geoengineering, Methane Eruptions, And Imploding Arctic Ice
Dane Wigington
GeoengineeringWatch.org
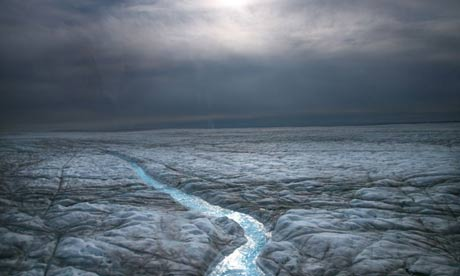
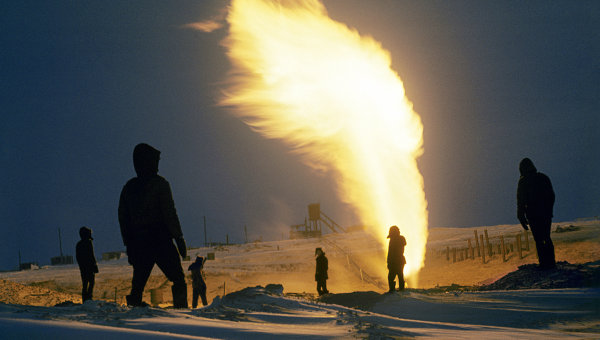
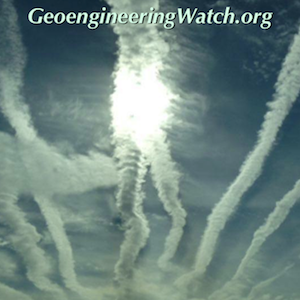
The East Siberian Sea is "boiling with methane", scientists have called what they are witnessing "truly terrifying". Massive methane eruptions are pushing the planet toward Venus Syndrome. With the use of patented artificial ice nucleating elements / processes, the climate engineers are completely committed to chemically ice nucleating the polar regions. Geoengineering operations are part of an unimaginably desperate and destructive attempt to cover up the rapidly unfolding methane catastrophe. For well over 70 years global powers have been consistently ramping up covert climate engineering programs that have now all but completely derailed the planet's life support systems. Without the knowledge or consent of their populations, governments around the world colluded and collaborated on the organization and deployment of incredibly destructive climate "intervention" programs that are further fueling the catastrophic consequences of anthropogenic activity on planet Earth. Of all the forms of decimation the human race has inflicted on our formerly thriving biosphere, the ongoing geoengineering assault is mathematically the most ominous and destructive.
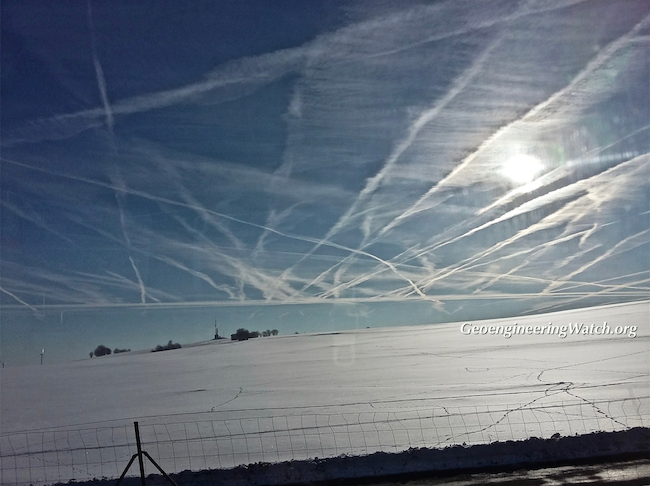
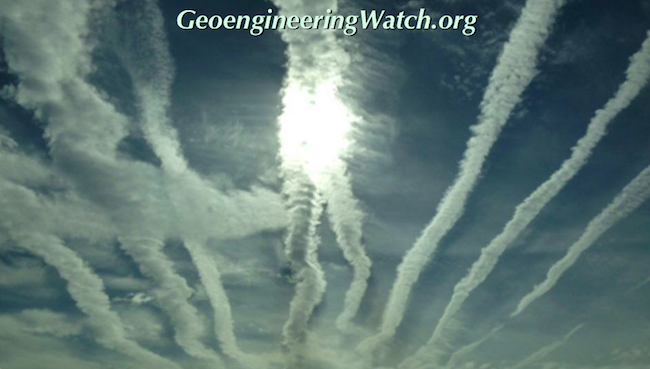
Geoengineering/solar radiation management programs are obscuring skies and completely disrupting climate patterns all over the globe. Photo credit: Piotrek Biraga
Earth's climate during the past 10,000 years has likely been the most stable in the history of our planet. The miraculous energy balance, previously maintained by our atmosphere, has now been completely destroyed. In an unimaginably desperate and insane attempt to hide the extent of biosphere damage (due to countless forms or human activity including climate engineering) from unsuspecting populations for as long as possible, the global power structure may have sealed our fate. Climate engineering/intervention programs are NOT about the common good in any way, shape, or form. Rather, such hubris is about power and control, period. The planet is now reacting and responding to the damage done, the signs are ominous.
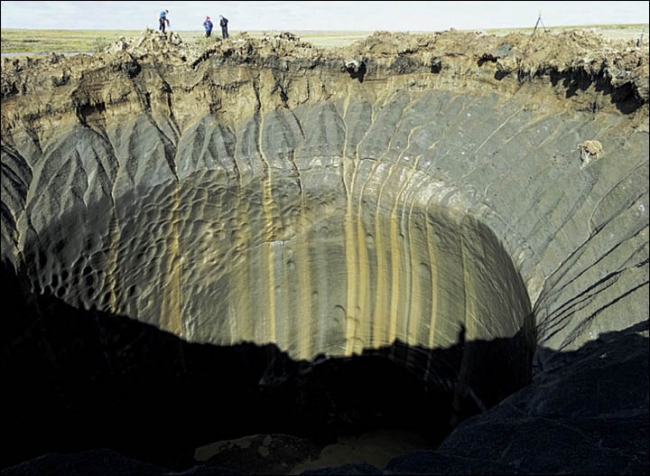
Scientists have discovered as many as 7,000 gas-filled "bubbles" expected to explode in Arctic regions of Siberia after an exercise involving field expeditions and satellite surveillance, TASS reported.
Click image to enlarge
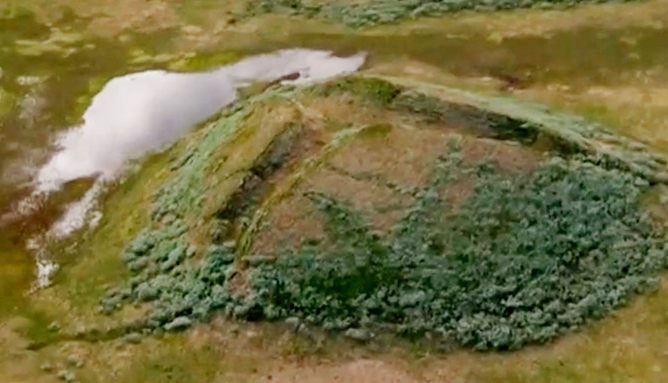
Like giant blisters on Siberian landscape, countless bulges are being pushed up from the explosive force of rapidly thawing methane deposits in the permafrost. Photo credit: The Siberian Times"
When enough pressure is built up from the heating and expanding methane, an eruption of immense force occurs.
Click images to enlarge
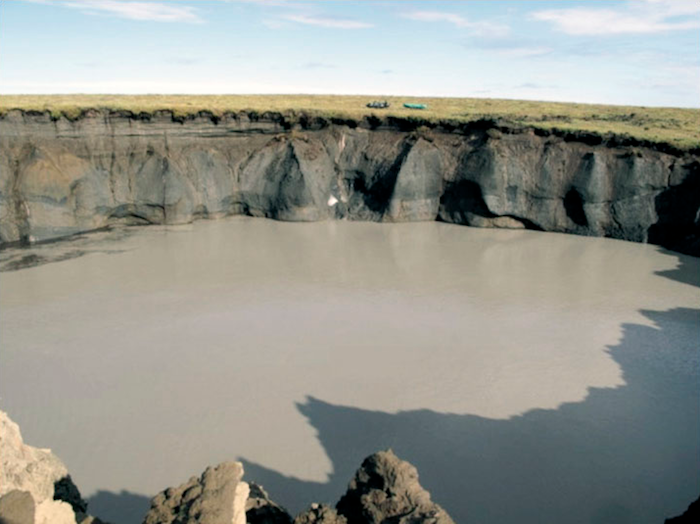
Recently the inhabitants in the Taimyr Peninsula reported hearing a "big bang", another methane blowout was formed. Photo credit: Sergei Lapsui, Stanislav Yaptune, Vladimir Epifanov
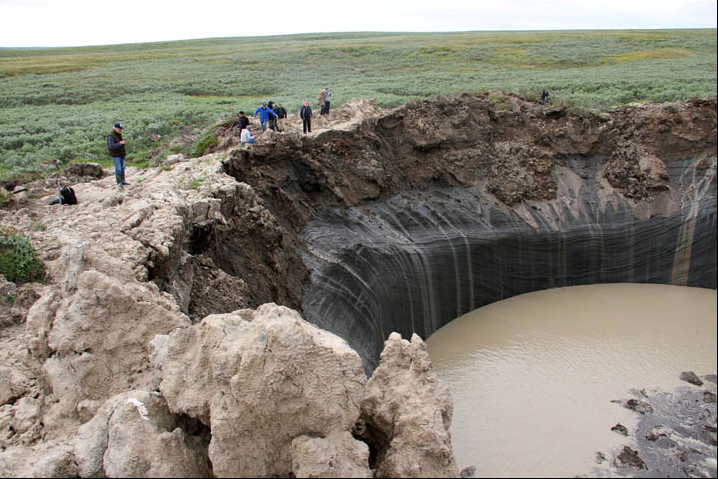
The methane craters are alarming harbingers of immense planetary change.
Click images to enlarge
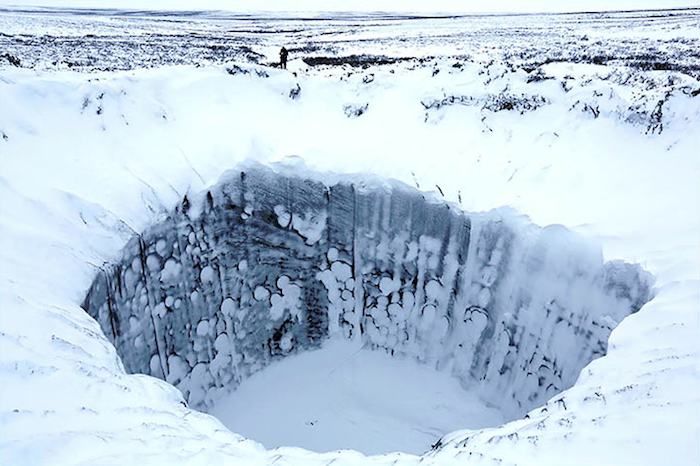
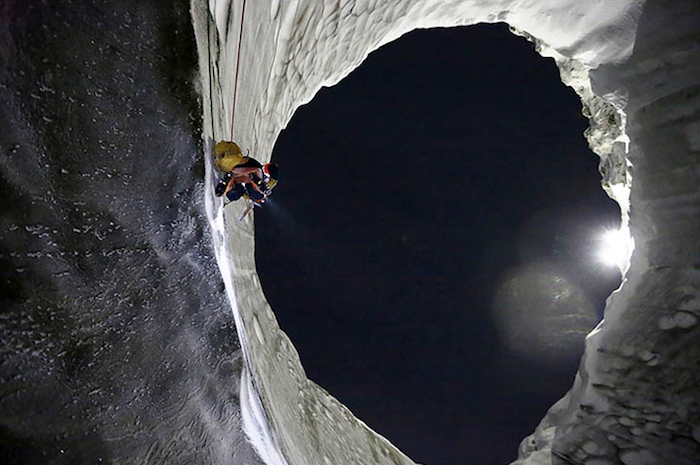
"This giant crater formed after pingo explosion near Bovanenkovo gas deposit in 2014". Photo credit: Vasily Bogoyavlensky, Yamal governor's press-service, Vladimir Pushkarev
Trump' Defense Secretary Cites Climate Change as National Security "Challenge"
“Climate change is impacting stability in areas of the world where our troops are operating today,” Mattis said
“It is appropriate for the Combatant Commands to incorporate drivers of instability that impact the security environment in their areas into their planning.”
The World Meteorological Organization (WMO) warned Tuesday that the drastic shifts seen in the global climate system that resulted in a range of alarming records last year appear to be continuing unabated.
"We are now in truly unchartered territory," David Carlson, head of the World Climate Research Programme, said in a release from the WMO.
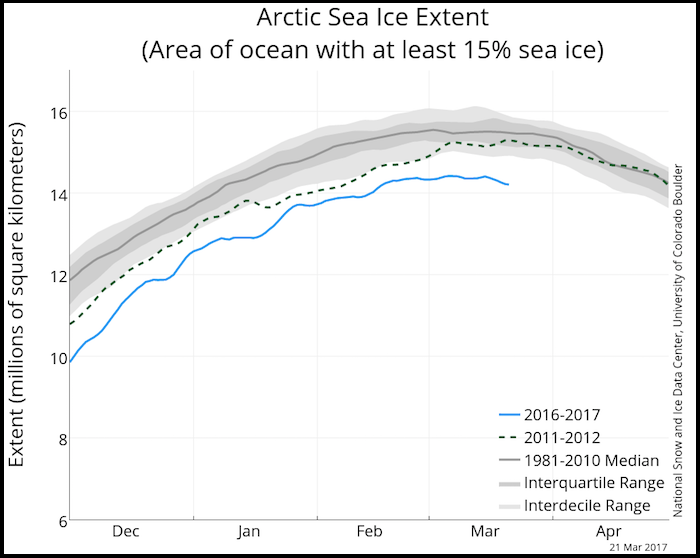
Arctic sea ice has just set yet another record low, breaking the former record low level set last year. The power structure and the geoengineers who serve it are increasingly desperate to mask the unfolding Arctic cataclysm. Why? To avoid panicking populations in order to maintain the current paradigm (and thus their stranglehold on power) till the last possible moment.
Click image to enlarge
Does this mean climate engineering is somehow for the greater good? Such a notion could not be further from the truth. Climate engineering programs are actually fueling the overall global meltdown while poisoning the entire planet in the process.
Security Challenge
James Mattis’ unpublished testimony before a Senate panel recognizes a threat others in the administration reject or minimize
Secretary of Defense James Mattis has asserted that climate change is real, and a threat to American interests abroad and the Pentagon's assets everywhere, a position that appears at odds with the views of the president who appointed him and many in the administration in which he serves.
In unpublished written testimony provided to the Senate Armed Services Committee after his confirmation hearing in January, Mattis said it was incumbent on the U.S. military to consider how changes like open-water routes in the thawing Arctic and drought in global trouble spots can pose challenges for troops and defense planners. He also stressed this is a real-time issue, not some distant what-if.
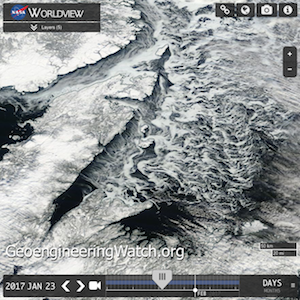
The recent NASA satellite images shown below reveal astoundingly anomalous sea surface ice formation patterns taking place in various regions of the Arctic (in spite of record high ocean temperatures). The anomalous ice formations are the result of climate engineering and chemical ice nucleating materials.
Click images to enlarge
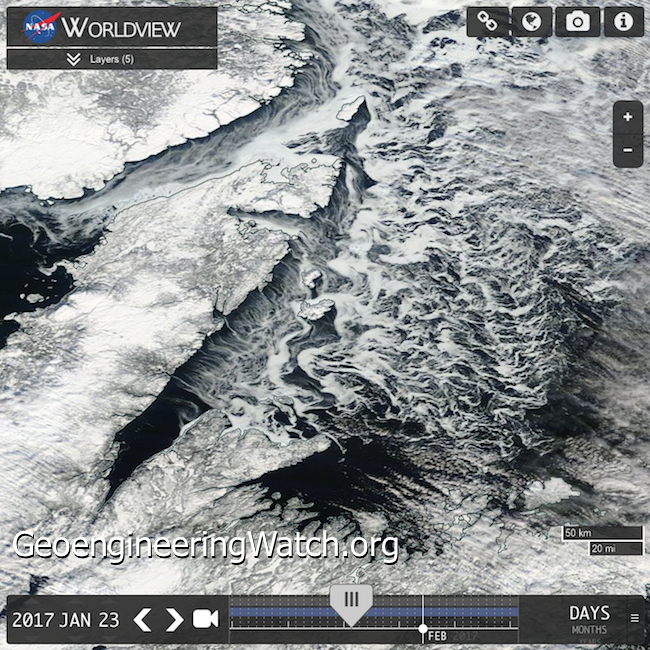
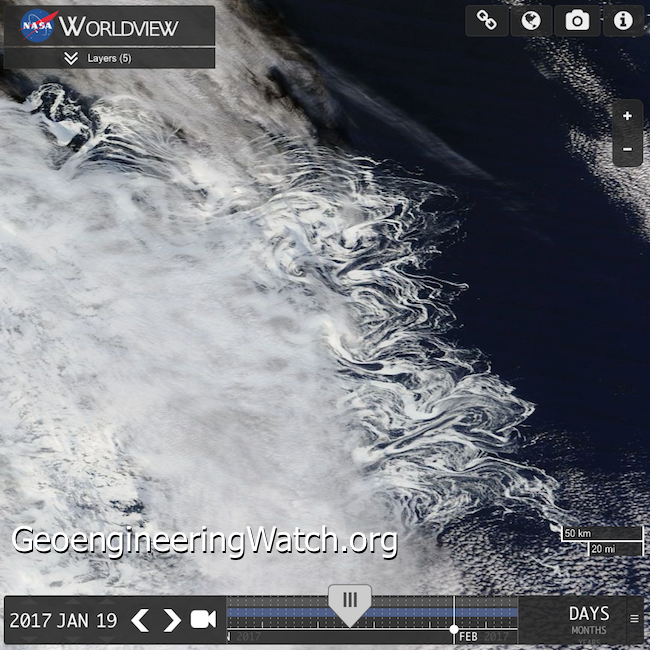
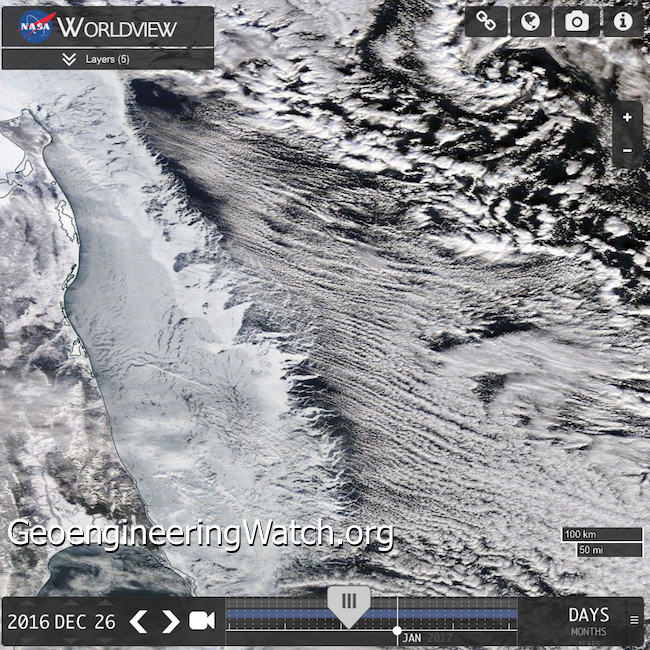
The patterns of ice formation along the perimeters of the ice resemble a chemical spill pattern of dispersion. Why? Chemical ice nucleation elements are being used. The power of these endothermic reacting materials is nearly beyond comprehension. Spherical ice balls forming on 40+ degree waters in Lake Michigan are only one example.
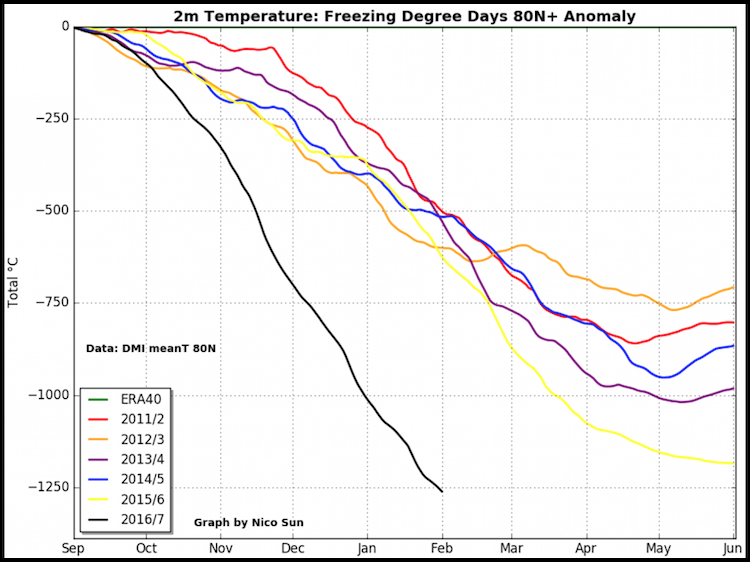
Given all the information already covered in this article, are the climate engineers actually helping to cool off the Arctic overall? No. When an artificially/chemically nucleated ice cap is engineered over an already overheated Arctic ocean, the ocean heat is trapped below this artificially enhanced engineered ice cap. The warmer seas then continue to thaw and thus release even more methane deposits from the sea floor. This process is further fueling feedback loops that are pushing the planet into a runaway climate shift.
Click image to enlarge

Global sea ice deposits are plummeting to record low levels in both polar regions.
Climate engineering is not mitigating the unfolding abrupt climate shift, it is exacerbating it.
Click image to enlarge
The current rate of biosphere change is so extreme and non-linear that many statistics are going "off the charts".
Climate engineering and atmospheric experimentation are greatly contributing to our rapidly disintegrating climate system. Life on Earth is now in completely uncharted territory, all life on our planet is in the balance. Are we powerless to alter the current equation? That answer remains to be seen or known. The final outcome will depend on what we collectively do, or don't do.
DW
May be freely reprinted, so long as the text is unaltered, all hyperlinks are left intact, and credit for the article is prominently given to GeoengineeringWatch.org and the article’s author with a hyperlink back to the original story.
Methane Plume Seen On Radar Returns Moving NW From Offshore SW Of San Francisco Moving Toward Reno, Nevada
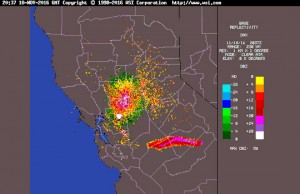
Source: otterwalks
Methane deposits are abundant on the continental margin of the Pacific Northwest coast as more methane is seen being released southward. It is calculated that warming at this depth would theoretically destabilize methane deposits on the Cascadia subduction zone, which runs from northern California to Vancouver Island, as well as other areas heading southward along the west coast. The Ring of Fire, with its Geologic processes, is one action which creates fissures allowing this type of release. Other potential Action/Reaction, Cause and Effect potentials, will be addressed here.
Here is a Link with more links to foundational research on the Methane GHG Issue. Methane is roughly thirty times more potent than CO2 as a heat trapping gas. There have been numerous Global Extinction Events over Earth’s history. Methane has been a culprit, the primary cause, in several of these events.
Geoengineered Forest Fire Incineration, Dark Ice, And Methane Extinction

Dane Wigington
geoengineeringwatch.org
Record forest fires are raging around the globe, climate engineering is a primary factor fueling the planetary burning. All over the northern hemisphere boreal forests are going up in flames and smoke, further loading the atmosphere with Co2 and soot. This in turn triggers multiple climate feedback loops which causes much more rapid warming than what is already occuring.
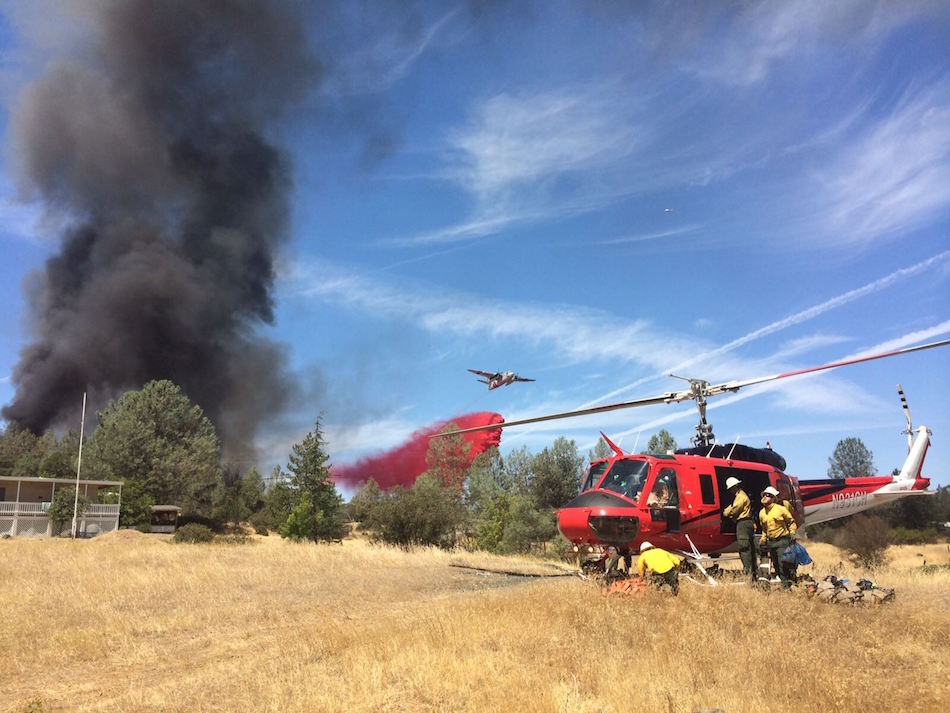
White Cloud Helibase on the Tahoe National Forest. Murphy Fire on AEU CalFire unit. Photo credit: Chester Helitack
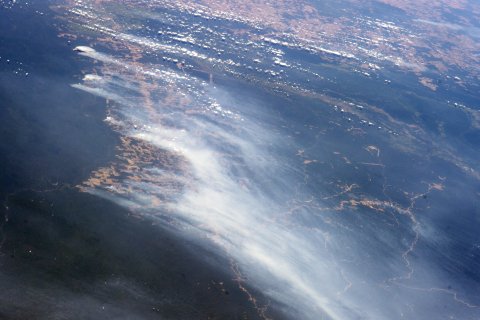
Siberian forests have been burning at a record pace in recent years. In April of 2015 the process began again. Regions in Siberia that have historically remained frozen until mid June were fully ablaze by early April.
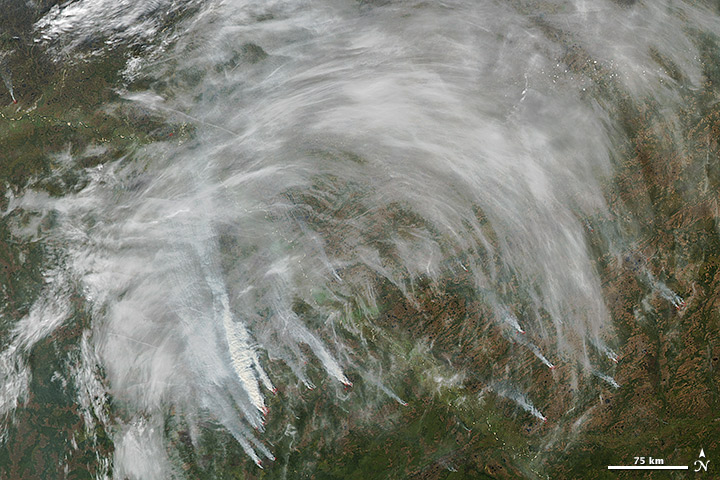
The satellite image above shows clearly that by late April, 2015, the Siberian landscape was riddled with fires.
Alaska is also being scorched after a record warm winter and record low snowfall. While the US mainstream media kept the public distracted with the "Boston snow" story during the 2014-2015 winter, Alaska was warm, dry, and setting up for the coming summer burning.
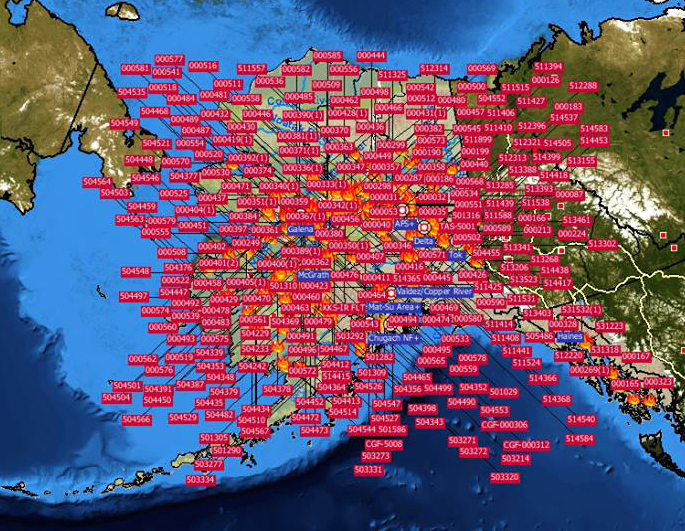
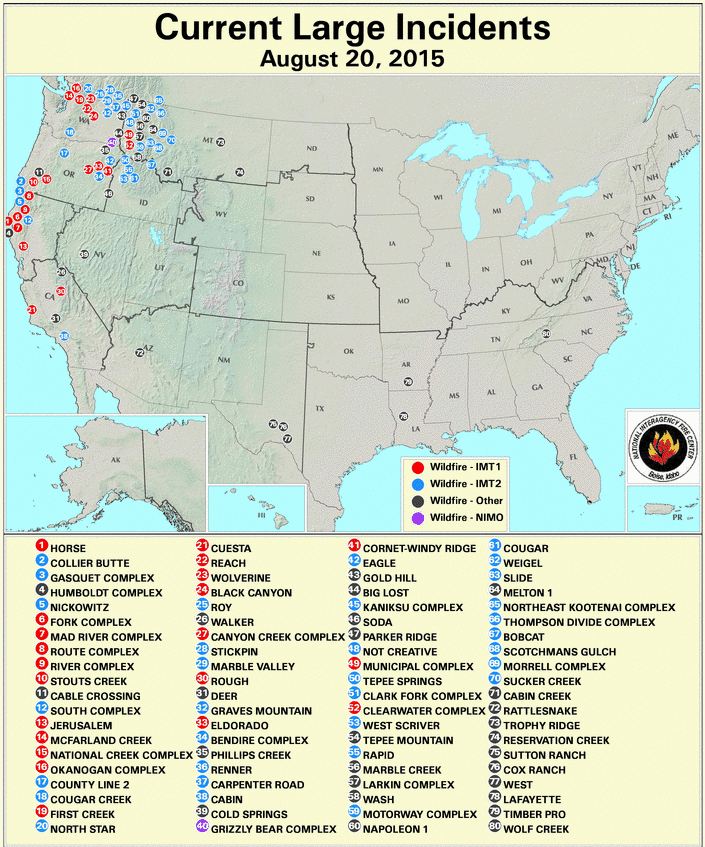
The map above reveals a staggering number of wildfires in Alaska even as summer was just beginning.

In early July there were more than 418 wildfires actively burning in Canada. By that date in 2015 there had already been more than 4,500 fires that had charred more than 2,150,000 hectares of forest. This was twice the number of fires that there were at this time last year when just over 2,200 fires burned 515,732 hectares of forest.
In the incredibly parched state of California numerous out of control fires have consumed landscapes, decimated wildlife, and destroyed many homes located in rural woodland regions. The climate engineers have been so consistent at blocking precipitation from California that one must ask the question, is California just a climate sacrifice zone, or a target of engineered drought?
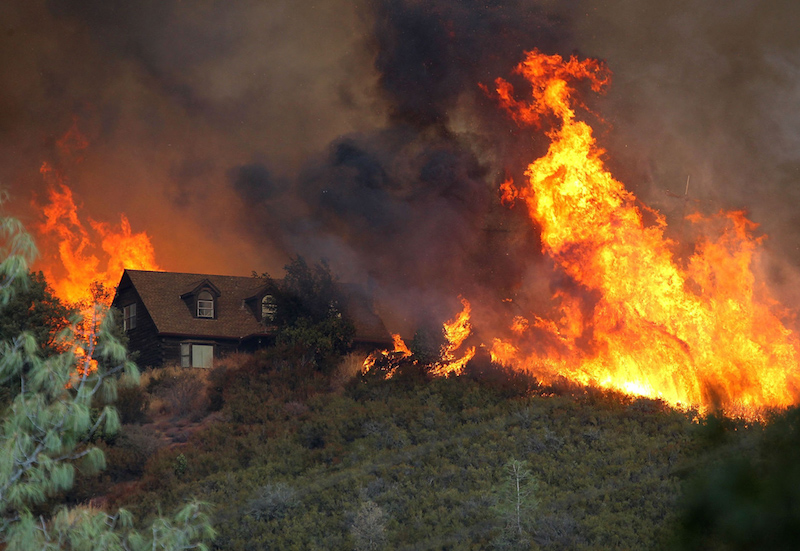
Flames from the Rocky Fire approach a house in Lower Lake, California. The fire, now contained, burned nearly 70,000 acres and destroyed 43 homes.
DW
Decorated War Veteran Adam Kokesh Addresses Climate Engineering And Catastrophic Methane Release
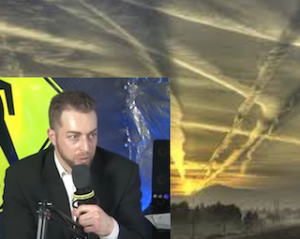
Adam Kokesh is completely dedicated to the fight for the common good. He is a former marine and a decorated war veteran. Adam has given his all to exposing the power structure and its ongoing crimes against humanity. This short interview addresses the dire issue of global climate engineering and the unfolding cataclysms geoengineering programs are fueling. So many of the unfolding global environmental cataclysms can in one way or another be directly linked to climate engineering as a causal factor. The entire climate system has been completely derailed, the ozone layer is decimated, the life support systems of the planet are breaking down. Exposing and halting climate engineering is not an option, it is an absolute necessity if life on Earth is to survive. Though this interview was done a while ago, it slipped through the cracks and never got posted at geoengineeringwatch. The information it contains is completely accurate and relevant today, this is confirmation of previous research and conclusions.
Dane Wigington
geoengineeringwatch.org
Microwaving The Atmosphere To Mitigate Methane
Dane Wigington
geoengineeringwatch.org
Methane is rapidly accumulating in the atmosphere, many more noctilucent clouds are being seen at ever lower latitudes. Methane is over 100 times more potent a greenhouse gas than Co2 over a ten year time horizon. If the methane releases continue, "Venus Syndrome" will be the end result.

Geoengineering/solar radiation management has been pushed as mitigation for the rapidly building global methane release cataclysm, but is climate engineering really a cure? Or has the decades long geoengineering insanity actually helped to trigger the methane catastrophe in the first place?
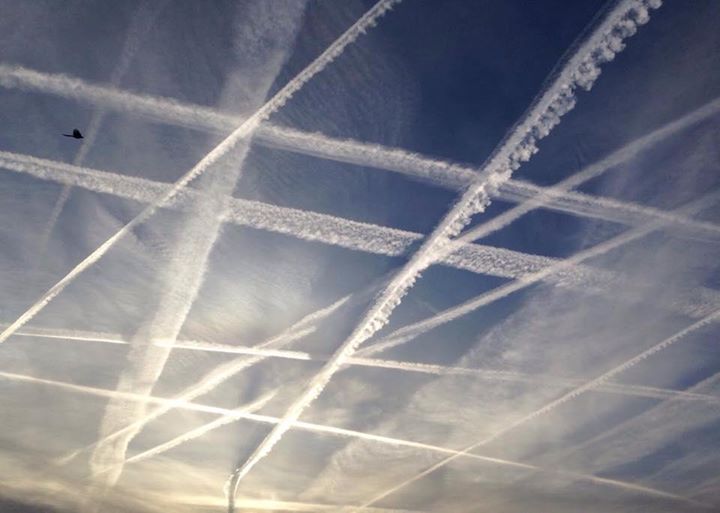
The delusion of the technological fix is unfortunately ingrained in the human psyche. This is how we have been trained and taught by the power structure. Modern industrialized/militarized technology now pushed the human race and all life on Earth well past the breaking point. On the current trajectory we face near term global extinction, this is a mathematical certainty. Only with a complete change of direction does the human race have any chance. Yet, even now, the indoctrination of academia and society prevails, the delusion of the "techno fix" (to what technology and anthropogenic activity caused in the first place) is rampant. What is the "science" community pushing now? Welcome to project LUCY and ALAMO, the intentional massive microwaving of the atmosphere with oppossing frequencies in an incredibly desperate and destructive attempt to molecularly degrade the atmospheric methane buildup.
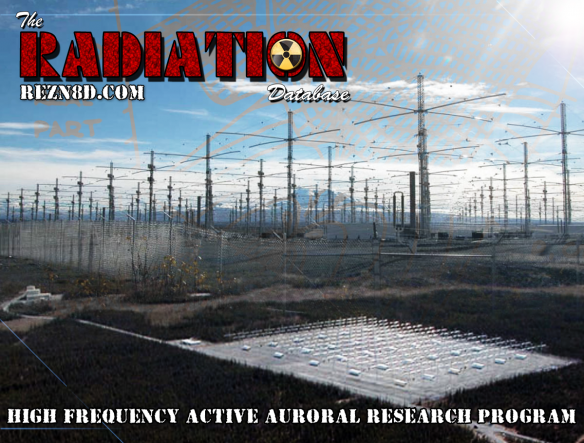
Large ground based ionosphere heater facilities like HAARP are likely being used for programs like project LUCY and ALAMO in addition to their use for weather modification and jet stream manipulation.
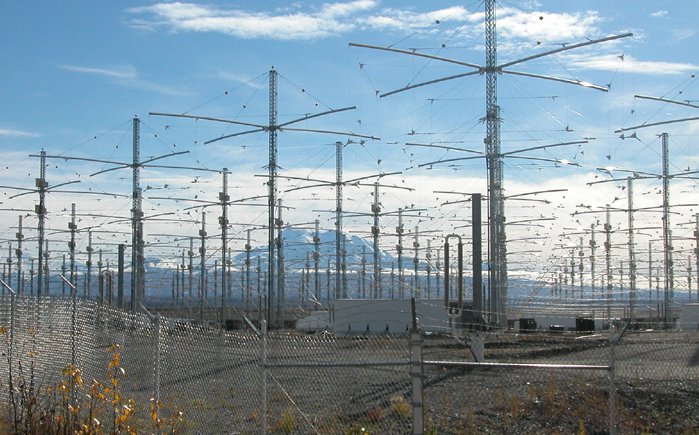
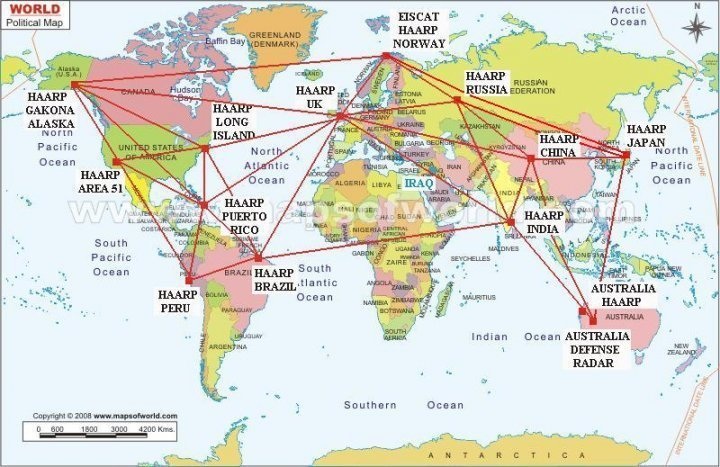
It is important to remember that there is a global network of these highly destructive ionosphere heater radio frequency transmission installations around the globe.
There are also the huge SBX radar platforms located around the globe. It is very likely these platforms (like the ground based RF transmitters) are also being used for weather modification and attempted methane mitigation.
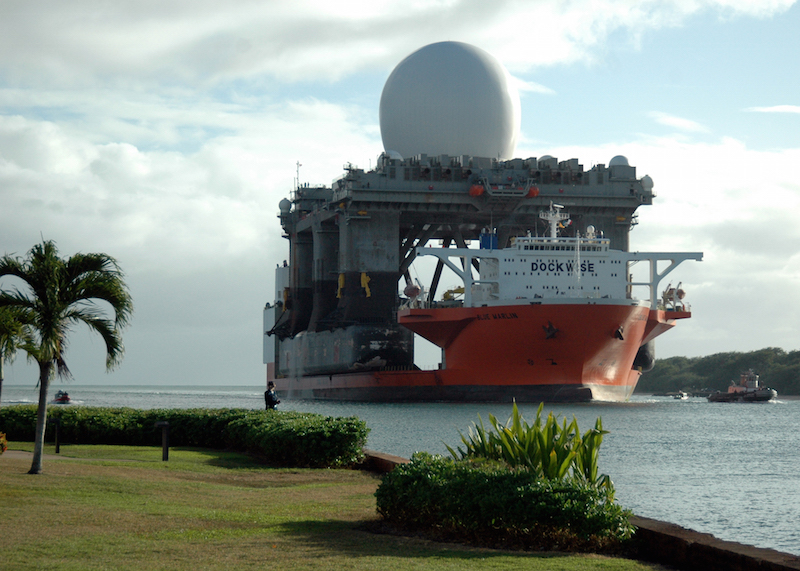
A diagram of using sea based transmission platforms is below, the technological "cure" delusion continues to push life on Earth toward certain extinction.

Microwave transmissions and toxic electrically conductive atmospheric spraying can and is killing trees, what are these transmissions doing to us? What are they doing to all life on Earth?

The blind faith in the science community must be tempered. It must be understood and realized that the military industrial complex has all but taken complete control of academia for its own ends. So many scientists are participating in research and activities that have already pushed us past the point of no return. Society must also consider its part in what has unfolded. For the most part, populations have abandoned any sense of reason and responsibility toward the common good in exchange for their lives of comforts and distractions. Caring for the future of our planet and our children requires action, it requires effort and prioritizing. Who will you help to awaken today? What steps will you take to help turn the course of the Titanic on which we are all currently passengers?
DW
Global Extinction within one Human Lifetime as a Result of a Spreading Atmospheric Arctic Methane Heat wave and Surface Firestorm
Source: RobinWestenra @ Blogspot
Abstract
Although the sudden high rate Arctic methane increase at Svalbard in late 2010 data set applies to only a short time interval, similar sudden methane concentration peaks also occur at Barrow point and the effects of a major methane build-up has been observed using all the major scientific observation systems. Giant fountains/torches/plumes of methane entering the atmosphere up to 1 km across have been seen on the East Siberian Shelf. This methane eruption data is so consistent and aerially extensive that when combined with methane gas warming potentials, Permian extinction event temperatures and methane lifetime data it paints a frightening picture of the beginning of the now uncontrollable global warming induced destabilization of the subsea Arctic methane hydrates on the shelf and slope which started in late 2010. This process of methane release will accelerate exponentially, release huge quantities of methane into the atmosphere and lead to the demise of all life on earth before the middle of this century.
Introduction
The 1990 global atmospheric mean temperature is assumed to be 14.49 oC (Shakil, 2005; NASA, 2002; DATAWeb, 2012) which sets the 2 oC anomaly above which humanity will lose control of her ability to limit the effects of global warming on major climatic and environmental systems at 16.49 oC (IPCC, 2007). The major Permian extinction event temperature is 80 oF (26.66 oC) which is a temperature anomaly of 12.1766 oC above the 1990 global mean temperature of 14.49 oC (Wignall, 2009; Shakil, 2005).
Results of Investigation
Figure 1 shows a huge sudden atmospheric spike like increase in the concentration of atmospheric methane at Svalbard north of Norway in the Arctic reaching 2040 ppb (2.04 ppm)(ESRL/GMO, 2010 – Arctic – Methane – Emergency – Group.org). The cause of this sudden anomalous increase in the concentration of atmospheric methane at Svalbard has been seen on the East Siberian Arctic Shelf where a recent Russian – U.S. expedition has found widespread, continuous powerful methane seepages into the atmosphere from the subsea methane hydrates with the methane plumes (fountains or torches) up to 1 km across producing an atmospheric methane concentration 100 times higher than normal (Connor, 2011). Such high methane concentrations could produce local temperature anomalies of more than 50 oC at a conservative methane warming potential of 25.
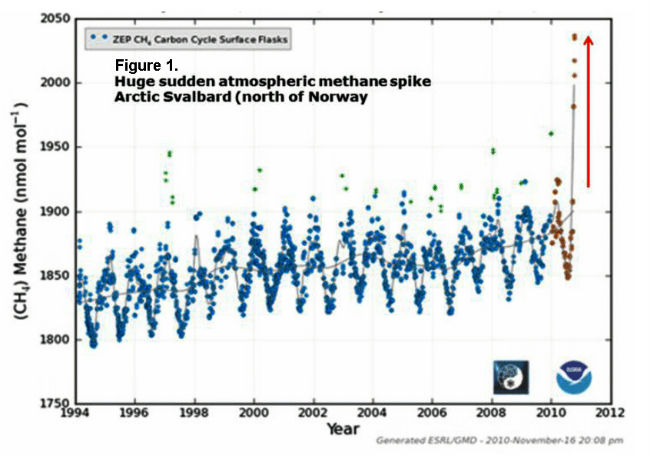
Figure 2 is derived from the Svalbard data in Figure 1 and the methane concentration data has been used to generate a Svalbard atmospheric temperature anomaly trend using a methane warming potential of 43.5 as an example. The huge sudden anomalous spike in atmospheric methane concentration in mid August, 2010 at Svalbard is clearly evident and the methane concentrations within this spike have been used to construct a series of radiating methane global warming temperature trends for the entire range of methane global warming potentials in Figure 3 from an assumed mean start temperature of -3.575 degrees Centigrade for Svalbard (see Figure 2) (Norwegian Polar Institute; 2011).
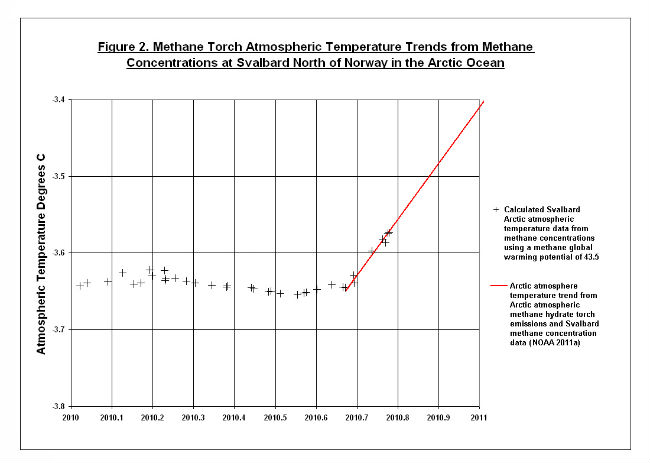
Figure 3 shows a set of radiating Arctic atmospheric methane global warming temperature trends calculated from the steep methane atmospheric concentration gradient at Svalbard in 2010 (ESRL/GMO, 2010 – Arctic-Methane-Emergency-Group.org). The range of extinction temperature anomalies above the assumed 1990 mean atmospheric temperature of 14.49 oC (Shakil, 2005) are also shown on this diagram as well as the 80 oF (26.66 oC) major Permian extinction event temperature (Wignall, 2009).
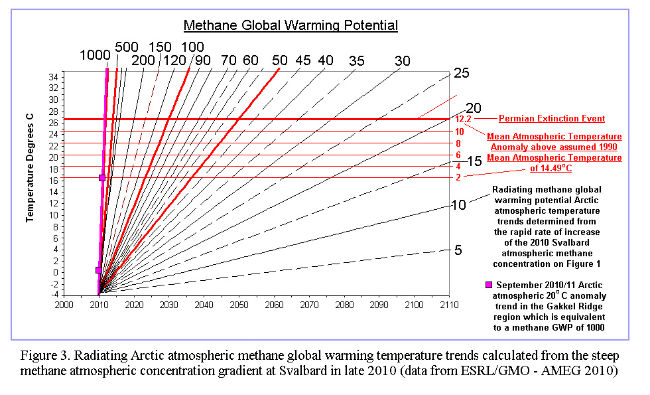
Sam Carana (pers. com. 7 Jan, 2012) has described large December 2011 (ESRL-NOAA data) warming anomalies which exceed 10 to 20 degrees centigrade and cover vast areas of the Arctic at times. In the centres of these regions, which appear to overlap the Gakkel Ridge and its bounding basins, the temperature anomalies may exceed 20 degrees centigrade. The temperature anomalies in this region of the Arctic for the period from September 8 2011 to October 7, 2011 were only about 4 degrees Centigrade above normal (Carana, pers. com. 2012). This data set can be seen on this site:- http://arctic-news.blogspot.com/p/arctic-temperatures.html
Because the Svalbard methane concentration data suggests that the major spike in methane emissions began in late 2010 it has been assumed for calculation purposes that the 2010 temperature anomalies peaked at 4 degrees Centigrade and the 2011 anomalies at 20 degrees Centigrade in the Gakkel Ridge region. The assumed 20 degree Centigrade temperature anomaly trend from 2010 to 2011 in the Gakkel Ridge region requires a methane gas warming potential of about 1000 to generate it from the Svalbard methane atmospheric concentration spike data in 2010. Such high methane warming potentials could only be active over a very short time interval (less than 5.7 months) as shown when the long methane global warming potential lifetimes data from the IPCC (2007; 1992) and Dessus, Laponte and Treut (2008 ) are used to generate a global warming potential growth curve with a methane global warming potential of 100 with a lifespan of 5 years.
Because of the high methane global warming potential (1000) of the 2011, 20 oC temperature anomalies in the Gakkel Ridge region, the entire methane global warming potential range from 5 to 1000 has been used to construct the radiating set of temperature trends shown in Figure 3. The 50, 100, 500 and 1000 methane global warming potential (GWP) trends are red and in bold. The choice of a high temperature methane peak with a global warming potential near 1000 is in fact very conservative because the 16 oC increase is assumed to occur over a year. The observed ESRL-NOAA Arctic temperature anomalies varied from 4 to 20 degrees over less than a month in 2011 (Sam Carana, pers. comm. 2012).
Figure 4 shows the estimated lifetime of a globally spreading Arctic methane atmospheric veil for different methane global warming potentials with the minimum, mean and maximum lifetimes fixed with data from Dessus, Laponche and Treut (2008) and IPCC (2007, 1992). On this diagram it is evident that the maximum methane global warming potential temperature trend of 50 intersects the 2 degree centigrade temperature anomaly line in mid 2027 at which time humanity will completely lose our ability to combat the earth atmospheric temperature rise. This diagram also indicates that methane will be an extremely active global warming agent for the first 15 years during the early stages of the extinction process. At the 80 o F (26.66 oC) Permian extinction event temperature line (Wignall, 2009), which has a 12.177 oC temperature anomaly above the 1980 mean of 14.49 oC, the lifetime of the minimum methane global warming potential veil is now some 75 years long and the temperature so high that total extinction of all life on earth will have occured by this time.
The life time from the almost instantaneous injection of methane into the atmosphere in 2010 is also shown as the two vertical violet lines (12 +- 3) years and this has been extended by 6 percent to 15.9 years to take account of increased methane concentrations in the future (IPCC, 1992b). This data set can be used to set up the likely start position for the extinction event from the large methane emissions in 2010.
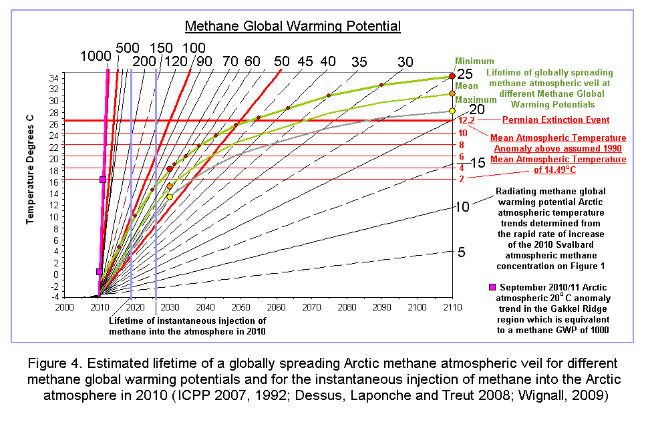
Figure 5 shows the estimated Arctic Gakkel Ridge earthquake frequency temperature increase curve (Light, 2011), the Giss Arctic mean November surface temperature increase curve (data from Carana, 2011) and the mean global temperature increase curve from IPCC (2007) long term gradient data. The corrected Arctic atmospheric temperature curve for the ice cap melt back in 2015 was derived from the mean time difference between the IPCC model ice cap and observed Arctic Ice cap rate of volume decrease (Masters, 2009). The ice cap temperature increase curve lags behind the Arctic atmosphere temperature curve because of the extra energy required for the latent heat of melting of the permafrost and Greenland ice caps (Lide and Frederickse, 1995).
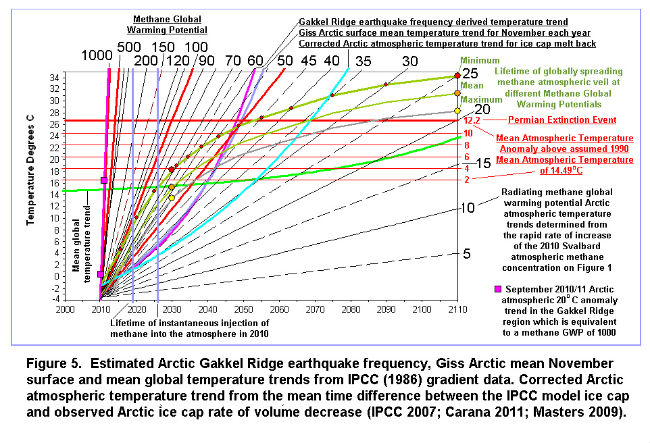
Figure 6 shows 5 mathematically and visually determined best estimates of the possible global atmospheric extinction gradients for the minimum (a), mean (b) and maximum (e) methane global warming potential lifetime trends. The mean (c) methane global warming potential lifetime trend has almost the identical gradient to the best mathematical fit over the temperature extinction interval (2 oC to 12.2 oC temperature anomaly zone) as the Arctic Gakkel Ridge frequency data (b) and the Giss Arctic mean November surface temperature data (d). This suggests that the Giss Arctic mean November surface temperature curve and the Arctic Gakkel Ridge frequency temperature curves are good estimates of the global extinction temperature gradient.
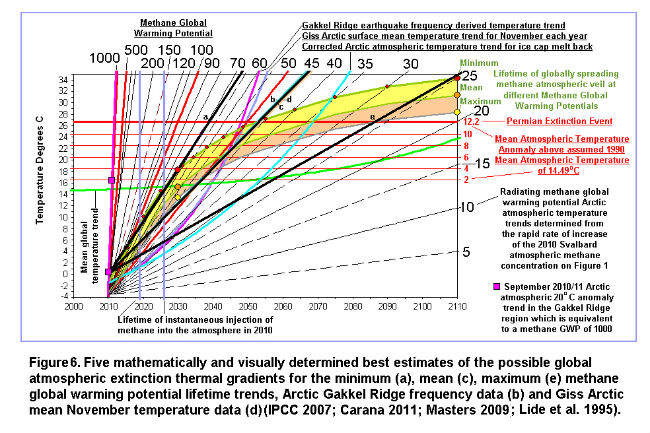
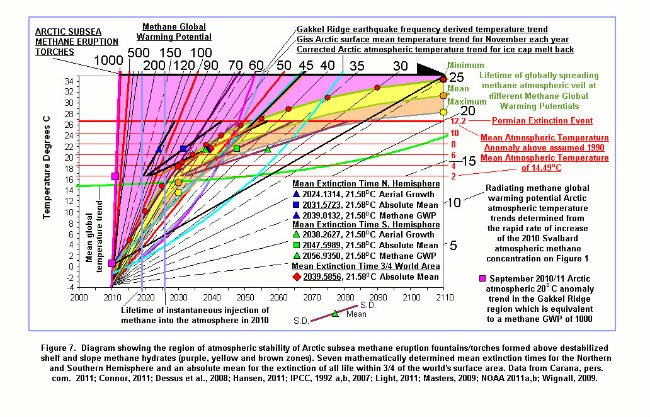
Figure 7 diagramatically shows the funnel shaped region in purple, yellow and brown of atmospheric stability of methane derived from Arctic subsea methane eruption fountains/torches formed above destabilized shelf and slope methane hydrates (Connor, 2011). The width of this zone expands exponentially from 2010 with increasing temperature to reach a lifetime of more than 75 years at 80 o F (26.66 oC) which is the estimated mean atmospheric temperature of the major Permian extinction event (Wignall 2009). The previous most catastrophic mass extinction event occured in the Permian when atmospheric methane released from methane hydrates was the primary driver of the massive mean atmospheric temperature increase to 80 oF (26.66 oC) at a time when the atmospheric carbon dioxide was less than at present (Wignall, 2009).
Method of Analysis
By combining fractional amounts of an assumed standard Arctic methane fountain/torch/plume with a global warming potential of 1000 (which equals a 16 oC temperature rise (4 – 20 oC) over one year – 2010 – 2011) with the mean global temperature curve (from IPCC 2007 – gradient data) it was possible to closely match the 5 visually and mathematically determined best estimates of the global extinction gradients shown in Figure 6 (a to e). Because the thermal radiant flux from the earth into space is a function of its area (Lide and Fredrickse, 1995) we can roughly determine how many years it will take for the methane to spread globally by getting the ratio of the determined fraction of the mean global temperature curve to the fraction of the Arctic methane fountain/torch/plume curve, as the latter is assumed to represent only one year of methane emissions. In addition as the earth’s surface area is some 5.1*10^8 square kilometres (Lide and Fredrickse, 1995) a rough estimate of the average area of the region over which the methane emissions occur within the Arctic can also be determined by multiplying the Arctic methane/torch/plume fraction by the surface area of the earth. The Arctic fountain/torch areas are expressed as the diameter of circular region of methane emissions or the two axes A and B of an ellipse shaped area of methane emissions (where B = 4A) (Table 1)
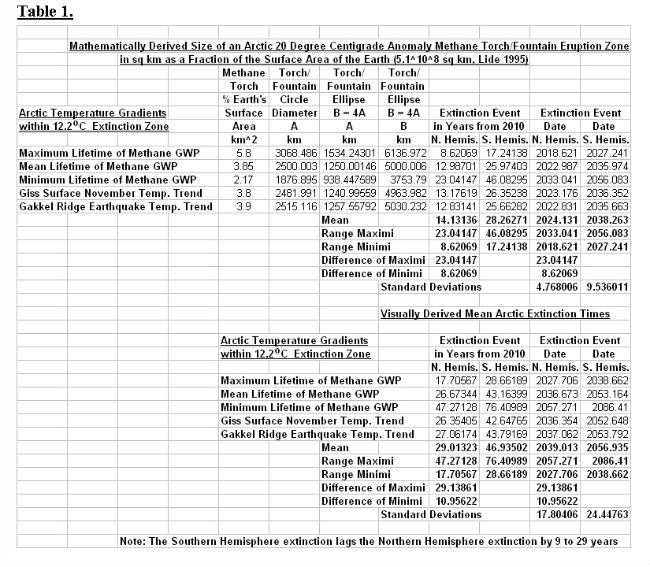
Twenty estimates have been made of the times of the various extinction events in the northern and southern hemispheres and these are shown on Table 1 and summarised on Figure 7 with their ranges. The absolute mean extinction time for the northern hemisphere is 2031.8 and for the southern hemisphere 2047.6 with a final mean extinction time for 3/4 of the earth’s surface of 2039.6 which is similar to the extinction time suggested previously from correlations between planetary orbital mechanics and the frequency increase of Great and Normal earthquake activity on Earth (Light, 2011). Extinction in the southern hemisphere lags the northern hemisphere by 9 to 29 years.
Figure 8 shows a different method of interpreting the extinction fields defined by the (12 +-3) + 6% year long lifetime of methane (IPCC, 1992) assumed to have been instantaneously injected into the Arctic atmosphere in 2010 and the lifetime of the globally spreading methane atmospheric veil at different methane global warming potentials. The start of extinction begins between 2020 and 2026.9 and extinction will be complete in the northern hemisphere by 2057. Extinction will begin around 2024 in the southern hemisphere and will be completed by 2087. Extinction in the southern hemisphere, in particular in Antarctica will be delayed by some 30 years. This makes property on the Transantarctic mountains of premium value for those people wish to survive the coming methane firestorm for a few decades longer..
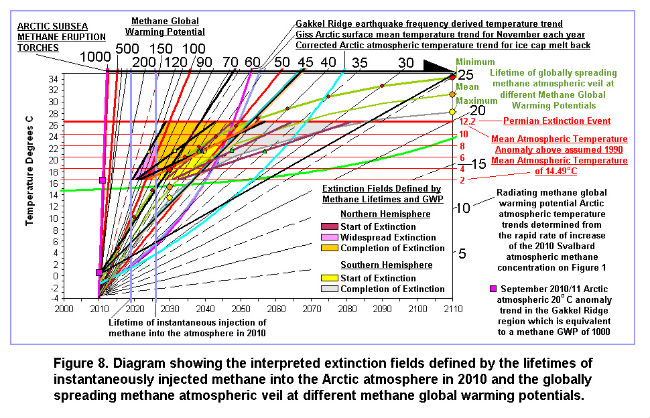
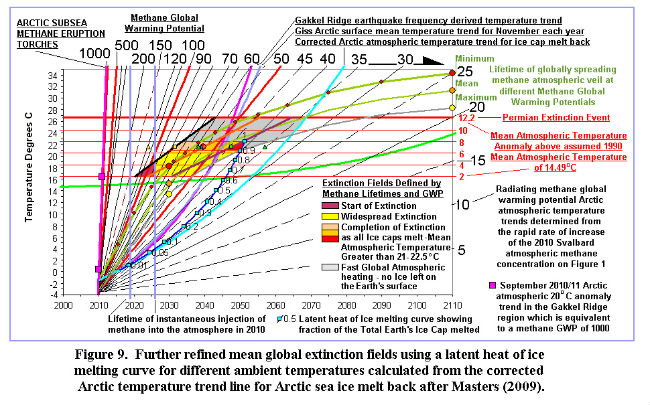
Figure 9. is a further refinement of the extinction fields shown in Figure 8. by defining a new latent heat of ice melting curve at different ambient temperatures which has been calculated from the corrected Arctic atmospheric temperature trend for the ice cap melt back defined by the difference between the Piomass observed melt back time and the IPCC modelled melt back time which predicts the melt back incorrectly some 50 years into the future (Masters, 2009). This work shows that the IPCC climate models are probably more than 100 years out in their prediction of the complete melting of the Greenland and Antarctic ice caps.
Method of Analysis
To melt 1 kg of ice you require 334 kilo Joules of energy (the latent heat of melting of ice) to transform the solid into the liquid at 0 oC (Wikipedia, 2012 ).
Subsequently for each one oC temperature rise, the water requires and additional 4.18 kilo Joules to heat it up to the ambient temperature (Wikipedia, 2012). An 80 oC temperature rise of a 1 kg mass of water requires almost exactly the same amount of energy input (334.4 kJ) as the amount of energy required by the latent heat of melting of ice (334 kJ) to covert one kg of ice into water at 0 oC. Because one Joule is the energy equivalent of the power of one watt sustained for one second there is also a time element in the melting of the ice and the heating up of the water, i.e. it is the function of temperature increase and the time similar to the way oil is generated in sediments (Lopatin, 1971; Allen and Allen, 1990).
If we consider the time necessary to melt one kg of ice and then raise its temperature to 80 oC, both of the above processes require the same amount of energy so we can consider that the first half of the time will simply involve conversion the solid ice into a liquid state at 0 oC and the second half of the time in heating the resulting ice water from 0 to 80 oC. This means that the ice melt curve at 80 oC will lag the atmospheric temperature line by half the time at 80 oC.
For temperatures less than 80 oC, the energy necessary to raise the water formed from the melted ice to the ambient temperature is less than that required for the latent melting of the ice (required to move it from a solid to a liquid state) and progressively more relative energy is needed at low temperatures to melt the ice.
The following formulation has been used to calculate the ratio of the time necessary for the melting of 1 kg of ice to water a 0 oC to the time necessary for the heating up of the 1 kg of water produced from the melted ice to the specified ambient temperature.
For any power n, let 2^n represent the ambient temperature of 1 kg of water which was derived from the melting of 1 kg of ice.
The energy required for the original melting of the 1 kg ice to water at 0 oC (latent heat of melting of ice) = 2^(n-3)/10 = 2^n/(2^3*10) = 2^n/80 = ambient temperature/80
Examples;
Let n=1; therefore temperature = 2^1 = 2 oC
Latent heat of melting = 2^(n-3)/10 = 2^-2/10 = 1/10*1/(2^2) =1/10*1/4 = 1/40
Let n=5; therefore temperature = 2^5 = 32 oC
Latent heat of melting = 2^(n-3)/10 = 2^2/10 = 4/10
The ratio of the time required for the latent heat of melting at any temperature is the reciprocal of the above = 10/(2^n-3)
The total time is therefore
a.) The time necessary for the latent heat of melting to covert 1 kg of ice into water
at 0 oC = 10/(2^n-3)
and:-
b.) The time required to heat up the 1 kg of water up to a temperature of 2^n = 1.
The total time = (10/(2^n-3)+1)
Therefore the fraction of time needed to simply melt the ice to 0 oC before it is raised to the ambient temperature 2^n = 10/(2^n-3)/((10/(2^n-3))+1)
Now: ((10/(2^n-3)) +1) = (10+ (2^n-3))/(2^(n-3))
The total time is therefore = 10/(10+(2^n-3))
Examples showing the calculation of the time ratio of the energy of latent heat of melting of ice to form water at 0 oC to the energy necessary to raise the water to the ambient temperature are shown below:-
N 2^n oC Fraction Formula Fraction
0 1 10/(10+1/8) 0.9877
1 2 10/(10+1/4) 0.9756
2 4 10/(10+1/2) 0.9526
3 8 10/(10+1) 0.9091
4 16 10/(10+2) 0.8333
5 32 10/(10+4) 0.7143
6 64 10/(10+8) 0.5555
6.32193 80 10/(10+10) 0.5000
The time value at each temperature of the corrected Arctic atmospheric temperature trend from the observed ice cap melt back (Masters, 2009) has been multiplied by the above fraction for each ambient temperature to determine a new “latent heat of ice melting curve” which represents the temperature – time energy necessary for the complete melting of the ice to water at 0 oC without the additional energy needed to raise the water to the ambient temperature of the atmosphere. This latent heat of ice melting curve is shown as the dark blue line on Figure 9.
The maximum mean global atmospheric temperature above which all the world’s icecaps will have completely melted away is estimated to lie between 7 oC and 8 oC above the mean global temperature which here is taken as 14.49 oC in 1990 (IPCC, 2007). The critical temperatures above which the Earth will entirely lose its ice caps are between 21.49 oC and 22.49 oC. It has been found however that the latent heat of ice melting curve first intersects the maximum lifetime stability line for atmospheric methane calculated from the methane global warming potentials (see. Figure 3) at the 20.964 oC extinction line (6.474 degrees centigrade above the atmospheric mean temperature of 14.49 oC in 1980) at 2050.1 and the 22.49 oCextinction line (8 oC above the atmospheric mean temperature of 14.49 oC in 1980) at 2051.3. Therefore the limits of the final melting and loss of all ice on Earth have been fixed between the 6.474 oC and 8 oC anomalies above the 1990 mean atmospheric temperature of 14.49 oC. This very narrow temperature range includes all the mathematically and visually determined extinction times and their means for the northern and southern hemispheres which were calculated quite separately (Figure 7; Table 1).
Once the world’s ice caps have completely melted away at temperatures above 22.49 oC and times later than 2051.3, the Earth’s atmosphere will heat up at an extremely fast rate to reach the Permian extinction event temperature of 80oF (26.66 oC)(Wignall, 2009) by which time all life on Earth will have been completely extinguished.
The position where the latent heat of ice melting curve intersects the 8 oC extinction line (22.49 oC) at 2051.3 represents the time when 100 percent of all the ice on the surface of the Earth will have melted. If we make this point on the latent heat of ice melting curve equal to 1 we can determine the time of melting of any fraction of the Earth’s icecaps by using the time*temperature function at each time from 2051.3 back to 2015, the time the average Arctic atmospheric temperature curve is predicted to exceed 0 oC. The process of melting 1 kg of ice and heating the produced water up to a certain temperature is a function of the sum of the latent heat of melting of ice is 334 kilo Joules/kg and the final water temperature times the 4.18 kilo Joules/Kg.K (Wikipedia, 2012). This however represents the energy required over a period of one second to melt 1 kg of ice to water and raise it to the ambient temperature. Therefore the total energy per mass of ice over a certain time period is equal to (334 +(4.18*Ambient Temperature)*time in seconds that the melted water took to reach the ambient temperature. From the fractional time*temperature values at each ambient temperature the fractional amounts of melting of the total global icecaps have been calculated and are shown on Figure 9.
The earliest calculated fractional volume of melting of the global ice caps in 2016 is 1.85*10^-3 of the total volume of global ice with an average yearly rate of ice melting of 2.557*10^-3 of the total volume of global ice. This value is remarkably similar to, but slightly less than the average rate of melting of the Arctic sea ice measured over an 18 year period of 2.7*10^-3 (1978 to 1995; 2.7% per decade – IPCC 2007).This close correlation between observed rates of Arctic ice cap and predicted rates of global ice cap melting indicates that average rates of Arctic ice cap melting between 1979 and 2015 (which represents the projected time the Arctic will lose its ice cover – Masters, 2009) will be continued during the first few years of melting of the global ice caps after the Arctic ice cover has gone in 2015 as the mean Arctic atmospheric temperature starts to climb above 0 oC. However from 2017 the rate of melting of the global ice will start to accelerate as will the atmospheric temperature until by 2049 it will be more than 9 times as fast as it was around 2015 (Table 2).
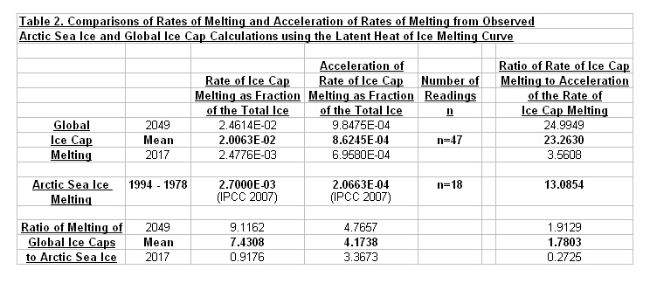
The mean rate of melting of the global icecap between 2017 and 2049 is some 2*10^-2, some 7.4 times the mean rate of melting of the Arctic ice cap (Table 2). In concert with the increase in rate of global ice cap melting between 2017 and 2049, the acceleration in the rate of melting also increases from 7*10^-4 to 9.9*10^-4 with a mean value close to 8.6*10^-4 (Table 2). The ratio of the acceleration in the rate of global ice cap melting to the Arctic ice cap melting increases from 3.4 in 2017 to 4.8 by 2049 with a mean near 4.2. This fast acceleration in the rate of global ice cap melting after 2015 compared to the Arctic sea ice cap melting before 2015 is because the mean Arctic atmospheric temperature after 2017 is spiraling upward in temperature above 0 oC adding large amounts of additional energy to the ice and causing it to melt back more quickly.
The melt back of the Arctic ice cap is a symptom of the Earth’s disease but not its cause and it is the cause that has to be dealt with if we hope to bring about a cure. Therefore a massive cut back in carbon dioxide emissions should be mandatory for all developed nations (and some developing nations as well). Total destruction of the methane in the Arctic atmosphere is also mandatory if we are to survive the effects of its now catastrophic rate of build up in the atmospheric methane concentration However cooling of the Arctic using geoengineering methods is also vitally important to reduce the effects of the ice cap melting further enhancing the already out of control destabilization of the methane hydrates on the Arctic shelf and slope.
· Developed (and some developing) countries must cut back their carbon dioxide emissions by a very large percentage (50% to 90%) by 2020 to immediately precipitate a cooling of the Earth and its crust. If this is not done the earthquake frequency and methane emissions in the Arctic will continue to grow exponentially leading to our inexorable demise between 2031 to 2051.
· Geoenginering must be used immediately as a cooling method in the Arctic to counteract the effects of the methane buildup in the short term. However these methods will lead to further pollution of the atmosphere in the long term and will not solve the earthquake induced Arctic methane buildup which is going to lead to our annihilation.
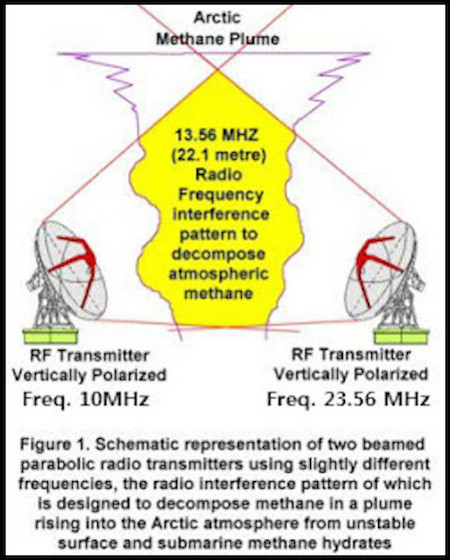
· The United States and Russia must immediately develop a net of powerful radio beat frequency transmission stations around the Arctic using the critical 13.56 MHZ beat frequency to break down the methane in the stratosphere and troposphere to nanodiamonds and hydrogen (Light 2011a) . Besides the elimination of the high global warming potential methane, the nanodiamonds may form seeds for light reflecting noctilucent clouds in the stratosphere and a light coloured energy reflecting layer when brought down to the Earth by snow and rain (Light 2011a). HAARP transmission systems are able to electronically vibrate the strong ionospheric electric current that feeds down into the polar areas and are thus the least evasive method of directly eliminating the buildup of methane in those critical regions (Light 2011a).
The warning about extinction is stark. It is remarkable that global scientists had not anticipated a giant buildup of methane in the atmosphere when it had been so clearly predicted 10 to 20 years ago and has been shown to be critically linked to extinction events in the geological record (Kennett et al. 2003). Furthermore all the experiments should have already been done to determine which geoengineering methods were the most effective in oxidising/destroying the methane in the atmosphere in case it should ever build up to a concentration where it posed a threat to humanity. Those methods need to be applied immediately if there is any faint hope of reducing the catastrophic heating effects of the fast building atmospheric methane concentration.
Malcolm Light 9th February, 2012
References
Arctic Methane Emergency Group
ameg.me
Allen, P.A., and Allen, J.R. Basin Analysis, Principles and Applications. Blackwell, Oxford, 451 pp.
Carana, S. 2011b. Light, M.P.R. and Carana, S. 2011c. – Methane linked to seismic activity in the Arctic.
http://arctic-news.blogspot.com/p/seismic-activity.html
Carana, S. 2011g. Runaway Global Warming.
http://geo-engineering.blogspot.com/2011/04/runaway-global-warming.html
Connor, S. 2011. Shock as retreat of Arctic sea ice releases deadly greenhouse gas. Russian research team astonished after finding fountains of methane bubbling to surface. The Independent.
http://www.independent.co.uk/environment/climate-change/shock-as-retreat-of arctic-sea-ice-releases-deadly-greenhouse-gas-6276134.html
DATAWeb, 2011. Combined Data Earth Policy Institute.
www.earth-policy.org/datacenter/…/update29_5x
Dessus, B., and Laponche B., Herve le Treut, 2008. Global Warming: The Significance of Methane bd-bl-hlt January 2008.
http://www.global-chance.org/IMG/pdf/CH4march2008.pdf
Hansen, J. E. 2011. GISS Surface Temperature Analysis. NASA. Goddard Institute for Space Physics. http://data.giss.nasa.gov/cgibin/gistemp/do_nmap.py?year_last=2011&month_last=08&sat=4&sst=1&type=anoms&mean_gen=02&year1=2009&year2=2009&base1=1951&base2=1980&radius=1200&pol=pol
Intergovernmental Panel on Climate Change (IPCC) 1992a. Climate Change. The IPCC Scientific Assessment (Edited by J. J. Houghton, G. J. Jenkins and J. J. Ephraums). Cambridge University Press, Cambridge. U.K.
Intergovernmental Panel on Climate Change (IPCC) 1992b. Climate Change in 1992. The Supplementary report to the IPCC Scientific Assessment (Edited by J. J. Houghton, B. A. Callander and S. K. Varney). Cambridge University Press, Cambridge. U.K.
Intergovernmental Panel on Climate Change (IPCC) 2007a. Fourth Assessment Report on Climate Change 2007. FAO 3.1, Figure 1, WG1, Chapter 3, p. 253.
http://blogs.ei.colombia.edu/wp-content/uploads/2010/12/graph-2-600X422.jpg
Intergovernmental Panel on Climate Change (IPCC) 2007b. Synthesis Report
http://www.ipcc.ch/publications_and_data/ar4/syr/en/spms1.html
Kennet, J.P., Cannariato, K.G., Hendy, I.L., Behl, R.J., 2003. Methane Hydrates in Quaternary Climate Change. The Clathrate Gun Hypothesis, Washington D.C., American Geophysical Union. ISBN 0875902960
Lide. D.R. and Frederikse H.P.R., 1995. CRC Handbook of Chemistry and Physics. 75th Edition, CRC Press, London. pp. 1-1 – 1-33.
Light M.P.R. 2011a. Use of beamed interfering radio frequency transmissions to decompose Arctic atmospheric methane clouds. Edited by Sam Carana.
http://arctic-news.blogspot.com/p/decomposing-atmospheric-methane.html
Lopatin, N.V. 1971. Temperature and geologic time as factors in coalification (in Russian). Akad. Nauk SSSR. Izvestiya. Seriya Geologicheskaya, 3, pp.95 – 106.
Masters. J. 2009. Top Climate Story of 2008. Arctic Sea Ice Loss. Dr Jeff Masters Wunderblog.
http://www.wunderground.com/blog/JeffMasters/comment.html?entrynum=1177
NASA, 2002. Global Temperature Anomalies in 0.1C. Goddard Institute for Space Studies., NASA Goddard Space Flight Center, Earth Sciences Directorate.
http://www.giss.nasa.gov/data, updated December 2002.
Norwegian Polar Institute, 2001. Svalbard, Climate:
http://www.npolar.no/en/the-arctic/svalbard/
NOAA 2011a. Huge sudden atmospheric methane spike Arctic Svalbard (north of – Norway)
http://arctic-news.blogspot.com/p/need-for-geo-engineering.html
NOAA 2011b. Huge sudden methane spike recorded at Barrow (BRW), Alaska, United States. Generated ESRL/GMO – 2011. December 14-17-21 pm
http://arctic-news.blogspot.com/p/need-for-geo-engineering.html
Rianovosti, 2011. Russian, US scientists set to study methane release in Arctic. ScienceRSS
http://en.rian.ru/science/20110902/166364635.html
Semiletov, I. 2011. Quoted from Itar-Tass. Heavy methane emissions found in the Arctic Eastern Sector. Itar-Tass. September 26, 2011.
http://www.itar-tass.com/en/c154/233799.html
Shakel M., 2005. Sustainability: Our Environment.
http://www.earthethicsinstitute.org/facultycurriculum-pdf/sustainability%20exploration20in%Mathematics.pdf
Shakova N., Semiletov, I., Salyuk, A., and Kosmach, D., 2008. Anomalies of methane in the atmosphere over the East Siberian Shelf. Is there any sign of methane leakage from shallow shelf hydrates? EGU General Assembly 2008. Geophysical Research Abstracts, 10, EGU2008-A-01526
http://meetings.copernicus.org/www.cosis.net/abstracts/EGU2008/01526/EGU2008-A-01526.pdf
Shakova, N. and Semiletov, I., 2010a. Methane release from the East Siberian Shelf and the potential for abrupt climate change. Presentation in November 30, 2010.
http://symposium2010.serdp-estcp.org/Technical-Sessions/1A
Shakova N., Semiletov, I., Leifer, I., Salyuk, A., Rekant, P., and Kosmach, D. 2010b. Geochemical and geophysical evidence of methane release over the East Siberian Arctic Shelf. Journal Geophys. Research 115, C08007
http://europa.agu.org/?view=article&uri=/journals/jc/jc1008/2009jcoo5602/2009jc005602.xml
Shakova, N., Semiletov, I., Salyuk, A., Yusupov, V., Kosmach, D., and Gustafsson, O., 2010c. Extensive methane venting to the atmosphere from sediments of the East Siberian Arctic Shelf. Science.
http://www.sciencemag.org/content/327/5970/1246.short
Wignall, P. 2009. Miracle Planet; Episode 4, Part 2. Coproduced by NHK (Japan) and the National Film Board of Canada (NFB).
http://www.youtube.com/watch?v=exfNNDExxic&list=PL0200B1S24E220C5A&feature=playerembedded#
Wikipedia., 2012. Enthalpy of Fusion.
http://en.wikipedia.org/wiki/Enthalpy_of_fusion
The following is a diagram by Sam Carana illustrating the progress

Source: RobinWestenra @ Blogspot
Methane Meltdown And The Geoengineered Attempt To Hide It

The latest engineered cool-down is hitting the East today, but how cold is it really?
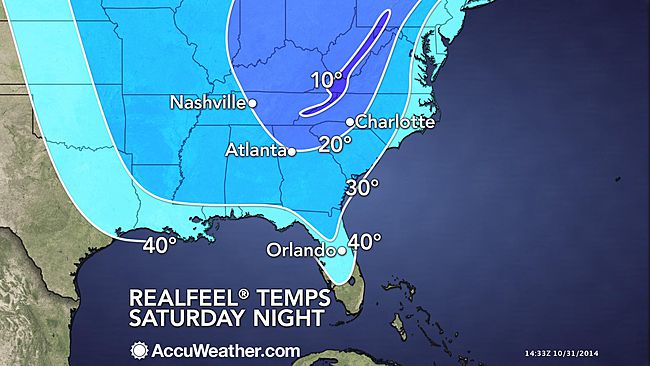
What are “real feel” temps? Real feel” is NOT the actual temperature. Why is “AccuWeather” using maps like the one above as if the temperatures shown are the actual temperatures? Because it adds to the illusion that it’s colder than it really is. On the map above it appears that Atlanta, GA may be in the 20 degree range on Friday, October 31st, 2014, when the actual forecast is for a high near 70F and a low near 40F.
So how warm is the rest of the country, and why don’t mainstream weather sources say anything about it?
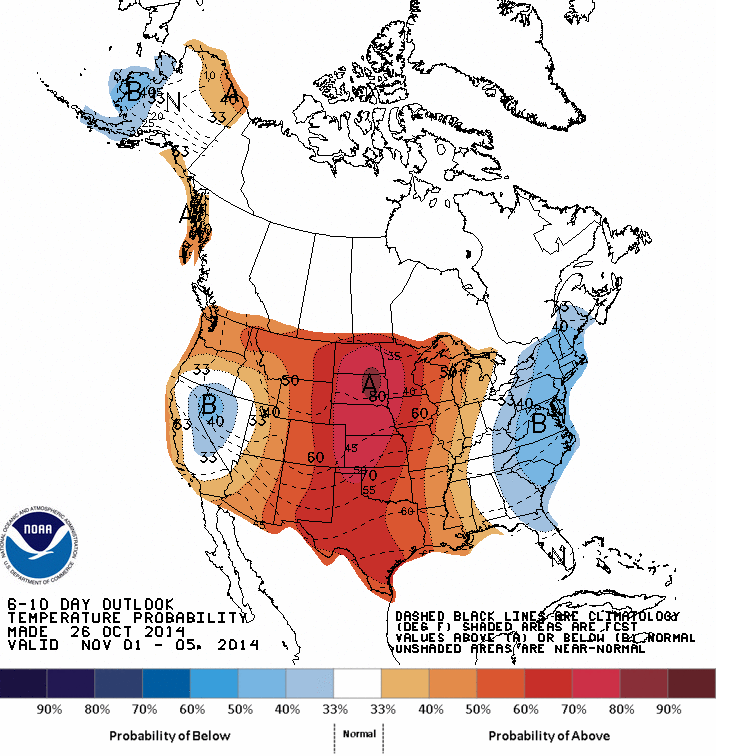
The map above shows a scenario of temperature extremes that is historically unprecedented. The center of the country is hovering in record high temperature ranges 20 degrees above normal while the engineered cool down in the East produces below average temperatures. The “bullseye” cool zone in the West is also worth noting.
So what is the bottom line? The planet is not just warming, it is in total meltdown. This is not about Al Gore, but about facts. If we are to gain credibility in the fight to expose and stop climate engineering, we must stand on facts, not ideology and emotion. Though the climate engineers can temporarily and toxically cool-down large regions, it comes at the cost of a much worsened overall warming. Global geoengineering is making an already bad climate unravelling exponentially worse overall. There is a great deal of denial on all sides of the fence in this equation. The climate science community is completely denying the reality of geoengineering, and much of the anti-geoengineering community is completely denying the rapid warming that is occurring which is to some degree being masked by climate engineering and corporate media spin. DO YOUR OWN OBJECTIVE RESEARCH, A HEADLINE IS NOT A FACT. Investigate data from the front lines.
So how bad is the climate situation likely to get? If climate engineering is not stopped, and if the human race does not completely change direction, the horizon is beyond bleak. The article below should be examined, global methane release is a major part of what the climate engineers and their corporate controlled media is trying to hide.Climate engineering is making the methane scenario worse, not better. All need to make their voices heard in the battle to wake the masses to the challenges we collectively face.
Dane Wigington
geoengineeringwatch.org
Ominous Arctic Methane Spikes Continue — 2666 Parts Per Billion on October 26th
Source: Robert Scribbler
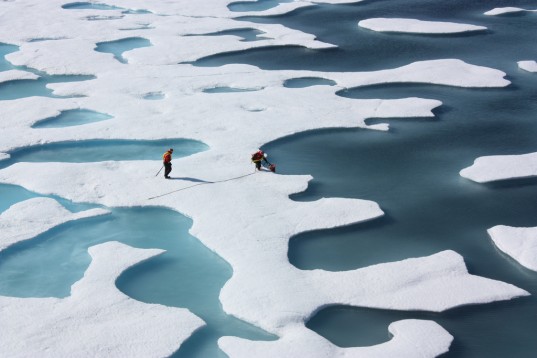
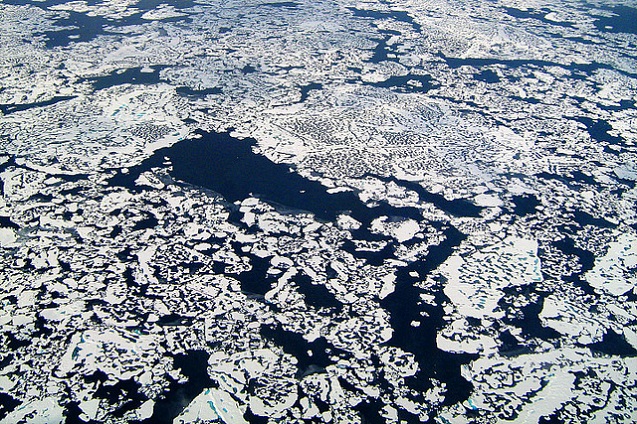
Imagine, for a moment, the darkened and newly liberated ocean surface waters of the Kara, Laptev, and East Siberian Seas of the early 21st Century Anthropocene Summer.
Where white, reflective ice existed before, now only dark blue heat-absorbing ocean water remains. During summer time, these newly ice-free waters absorb a far greater portion of the sun’s energy as it contacts the ocean surface. This higher heat absorption rate is enough to push local sea surface temperature anomalies into the range of 4-7 C above average.
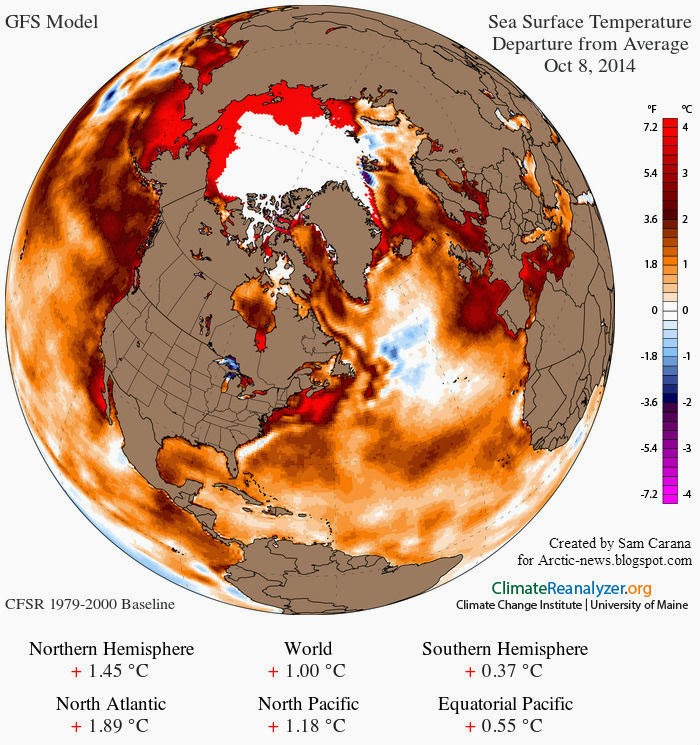
Remnant extreme heat at Arctic Ocean surface on October 8, 2014. Extraordinary warmth in the range 0f 4-7 C above average is due to recent loss of summer sea ice in the Kara, Laptev, East Siberian and Beaufort Seas. Newly exposed dark surface waters absorb more of the sun’s rays which results in a highly visible temperature anomaly. Image source: Climate Reanalyzer. Image archived by: Arctic News.
Some of the excess heat penetrates deep into the water column — telegraphing abnormal warmth to as far as 50 meters below the surface. The extra heat is enough to contact near-shore and shallow water deposits of frozen methane on the sea-bed. These deposits — weakened during the long warmth of the Holocene — are now delivered a dose of heat they haven’t experienced in hundreds of thousands or perhaps millions of years. Some of these deposits weaken, releasing a portion of their methane stores into the surrounding oceans which, in turn, disgorges a fraction of this load into the atmosphere.
The rate of release intensifies throughout summer. But during the Arctic Fall, it reaches a peak. Then, as sea ice begins to re-form over the surface waters, a kind of temperature inversion wedge develops. The surface cools and the ice solidifies — forming an insulating blanket, trapping heat. The insulating layer, in turn, pushes the anomalously hot mid level waters toward the bottom. This process delivers a final and powerful dose of heat to the Arctic Ocean bottom water and sea bed.
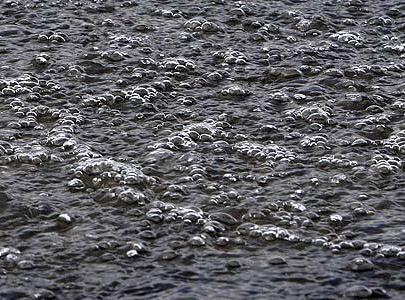
Methane release rates spike as the methane flooding up from the sea bed squeezes out through cracks in the newly forming ice or bubbles up through open waters just beyond the ice edge.
Observed Arctic Methane Over-Burden
During recent years, a troubling methane over-burden has been observed in the atmosphere above these regions during the months of September through November. Dr. Leonid Yurganov — a researcher at the University of Maryland — has been using the IASI sensor to record these events. Last year, he developed this map of September through November methane readings for the 2009-2012 period:
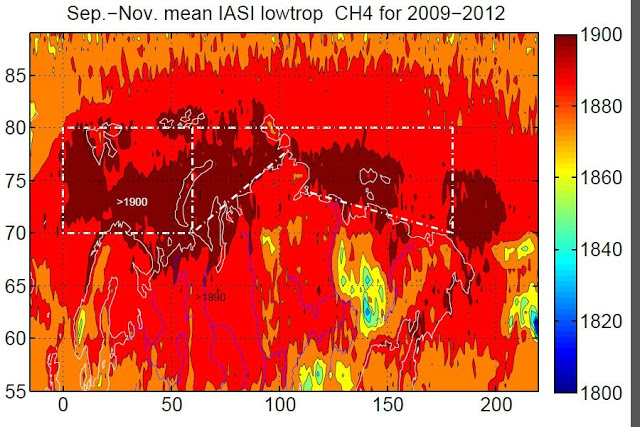
Highest lower troposphere global atmospheric methane readings were found in the region of the East Siberian, Laptev and Kara seas during September through November of 2009 through 2012. Data provided by IASI. Image source: Dr. Leonid Yerganov via Arctic News.
The readings above show near-surface averages over a three month period in the regions of highest release. Note that highest methane levels occur over coastal Siberia and in the above ocean zones of near-Russia Arctic Ocean waters.
These measurements have been ramping higher in recent years with near-surface readings in the range of 1950 to 2000 ppb now common for the months of September through November in the areas affected (for comparison, global surface averages are now in the range of 1840 ppm).
By themselves, these measurements are evidence of a substantial Arctic methane release. But further up in the troposphere — at the mid cloud level — even higher levels of methane have been recorded.
For as methane releases from the sea and land surface, it becomes trapped in the mid-cloud layer. There, a sandwich of cloud and moisture form a cap beneath which methane tends to concentrate. In this layer, readings can be quite a bit higher than surface measurements. Recent years have shown numerous instances where methane readings in the mid-cloud layer spiked above 2300 parts per billion.
Last year during September, the now annual plume of methane emitting from the Arctic Ocean pushed readings as high as 2571 parts per billion at this level of the atmosphere. It was a reading more than 700 parts per billion above the global surface average. A spike fueled by the anomalously high rates of methane emission from the Arctic surface waters and Siberian tundra during the Fall of 2013.
This year, despite extraordinarily spotty coverage due to cloud interference, the METOP sensor found Arctic methane concentrations in the range of 2666 parts per billion in the mid cloud layer. The spike occurred just this past Sunday and exceeds the September 2013 spike by 95 parts per billion — a level more than 800 parts per billion above current global surface averages.
Arctic methane spikes to 2666 parts per billion in the mid-cloud layer on Sunday October 26. Image source: OSPO/METOP.
In combination, observations of a rapidly warming Arctic Ocean and observations of Arctic methane readings between 6 and 60 percent above the global average in near surface regions and in the mid cloud layer are a clear signal that human-caused Arctic warming is forcing an ever-greater methane release. To a greater and greater extent, large carbon stores are being weakened and tapped by the various mechanisms that are an up-shot of human warming. The location of these large-scale releases, as observed in the satellite record, is confirmation of ground and ocean based observations conducted by Arctic researchers such as Dr. Semiletov and Shakhova. And the releases themselves may well be some validation of our more dire concerns.
This new spike is yet more evidence of a sizeable, anthropogenic-spurred, release that is impacting not only regional methane levels, but global levels as well. Whether this newly observed release is part of a slow global response to the initial human heat forcing — one that will take centuries to fully emerge — or is part of a much more rapid and dangerous response to an also very rapid human heat forcing is now unclear.
What is clear is that feedbacks to the human heat forcing are now starting to become plainly visible. That they are providing evidence of a stronger release from some sources on a yearly basis. A troubling amplifying feedback to the already dangerous and extraordinary human emission. One that should serve both as a warning and as a spur to reduce and eliminate human greenhouse gas emissions from all sources and to switch energy systems away from fossil fuels as swiftly as possible.
Source: Robert Scribbler
The Global Methane Emergency Is Now
Headlines released today from the frontline arctic scientists are the most dire yet. On the current trajectory there will be NO LIFE left on the planet by the middle of this century if the human race does not make a total course correction. What is not mentioned in these headlines is that the math points to a total end of life in the Northern Hemisphere much sooner. Methane hydrate is already spewing from the sea floor as warm water currents thaw the formerly frozen gas deposits. Methane seeps are now also being discovered all along the eastern seaboard and the arctic tundra is thawing as well (methane is over 100 times more potent a greenhouse gas than Co2 over a ten year horizon). Here is where the equation becomes complex in regard to people’s perspectives and conclusions from different sides of this issue. Denial is epidemic all the way around in one form or another. First, though the assessment from the front line scientists is accurate in regard to the critical nature of the emergency, these same scientists are in total denial on the issue of geoengineering. The entire scientific community is either denying or afraid to discuss the climate engineering elephant in the room. Climate scientists are not even willing to mention the geoengineering reality, let alone point out the fact that geoengineering has made the climate situation far worse overall, not better. Geoengineering is not about making anything better for the common good, its about power and control. On the other side of the fence there is unfortunately a lingering refusal to examine current facts to form an accurate picture. A large percentage of the anti-geoengineering movement is still convinced of exactly what the power structure and the climate engineers want them to believe, either that the climate system has not been damaged or even that the planet is cooling. Geoengineered cool downs are still confusing many for the moment, but the overall meltdown of the planet cannot be hidden much longer as massive amounts of methane belch into the atmosphere. The article below is well worth the time to read. All must learn to “sift the baby from the bathwater” so to speak. We can not “connect the dots”, if bias and preconception blinds us to the facts. Though there are countless sources of anthropogenic damage to our biosphere, the ongoing climate engineering is the greatest of all. Once the issue of geoengineering is fully exposed, the climate science community will have much explaining to do. I look forward to that day.
Dane Wigington
geoengineeringwatch.org
Storms will wreak havoc in the Arctic with probability of Methane Hydrates being released abruptly
Source: Daily KOS
We know that some things are adapting to a warmer climate by migrating north. Some of these species include the Mangrove forest, butterflies, fish, mosquitos and many others. NOAA has added a terrifying new entry to this list, the latitude where hurricanes, typhoons, and cyclones reach their maximum intensity.
The Giant Methane Monster Lurking
There’s something lurking deep under the frozen Arctic Ocean, and if it gets released, it could spell disaster for our planet.
That something is methane.
Arctic Death Spiral and the Methane Time Bomb

If we are to be effective in the fight to expose and stop climate engineering, it is essential to have a clear understanding of reality. All of us must get past ideology and preconceptions in order to put the correct dots together. Each of us MUST learn to sift through data from all sources in our search for truth. We must try to look through a clear lens in order to see an accurate picture. The video below unfortunately does not mention the critical issue of the ongoing climate engineering and thus does not take into consideration the cataclysmic effects of the same. It is likely if the film makers did mention geoengineering, this video would have never been allowed given the status of the participants. In spite of the climate engineering omission the unfolding events on the ground which are outlined in this video are beyond dispute. The fact that climate engineering is not mentioned, does not negate reality.
Those who truly wish to understand the current state of the climate and the planet’s life support systems will take the time to view this exceptional video.
Dane Wigington
geoengineeringwatch.org
“Arctic Methane And Arctic Sea Ice, What’s The Real Story?”

Mass Methane Release Accelerating
Mass methane release appears to be picking up speed by the day in the Arctic as well as countless other locations around the globe.
Arctic Ice Imploding, Methane Releasing

The geoengineers threw everything they had at the Arctic in late July. The ridiculous cooling anomaly they created (which all the media hyped up) has now totally imploded.
Methane and the risk of runaway global warming
Research was published this week showing the financial cost of methane being released from Earth’s permafrosts. But the risks go beyond financial – Earth’s history shows that releasing these stores could set off a series of events with calamitous consequences.
Methane Release And The Geoengineering “Cure” That Is Fueling The Fire

The baby must be taken from the bathwater in the recent article posted below. The data in this article relating to the methane release and the danger it poses is in my view accurate enough.The details outlined in this same article that reference the jet stream alterations, with no mention whatsoever of the HAARP ionosphere heaters around the globe, is pure spin. Then there is the call for immediate geoengineering to be done as if it has not already been going on for decades, this is the final blatant lie.
Methane Release And The Geoengineering "Cure" That Is Fueling The Fire
The baby must be taken from the bathwater in the recent article posted below. The data in this article relating to the methane release and the danger it poses is in my view accurate enough.The details outlined in this same article that reference the jet stream alterations, with no mention whatsoever of the HAARP ionosphere heaters around the globe, is pure spin. Then there is the call for immediate geoengineering to be done as if it has not already been going on for decades, this is the final blatant lie.
HAARP Geoengineering with Alchemy, Arctic Methane Global Emergency, UK Gov tells climate alarmists to “Chill Out”
The Arctic Methane Group (AMEG) is a group of scientists/concerned citizens studying the release of methane trapped under our North Pole’s icecap. They claim that not only is methane currently being released, it is poised to explode again as it did in the dinosaurs age:
Geoengineering Watch Global Alert News, December 19, 2020, #280
Dane Wigington
GeoengineeringWatch.org
Pfizer executives don’t seem willing to take their own creations, they want others to take them first. Why? In the meantime governments around the world are laying out their strategies for pressuring public acceptance of various experimental vaccines in spite of increasing safety concerns. Cascading climate and environmental collapse continues to fuel unprecedented desperation on the part of the controllers. More science sources are beginning to acknowledge the looming Earth changes, though such sources often falsely blame Nature for what is unfolding. A stunning recent example of diversionary disinformation is a “science” report that blames the unfolding methane release crisis in the Arctic on the influence of the moon. The report made no mention of the ongoing geoengineering operations that are actually at the core of the equation. How long will the “science” community continue with their efforts to cover the tracks of the climate engineers? The latest installment of Global Alert News is below.
All are needed in the critical battle to wake populations to what is unfolding on numerous fronts, we must make every day count. Share credible data from a credible source, make your voice heard. Awareness raising efforts can be carried out from your own home computer.
DW
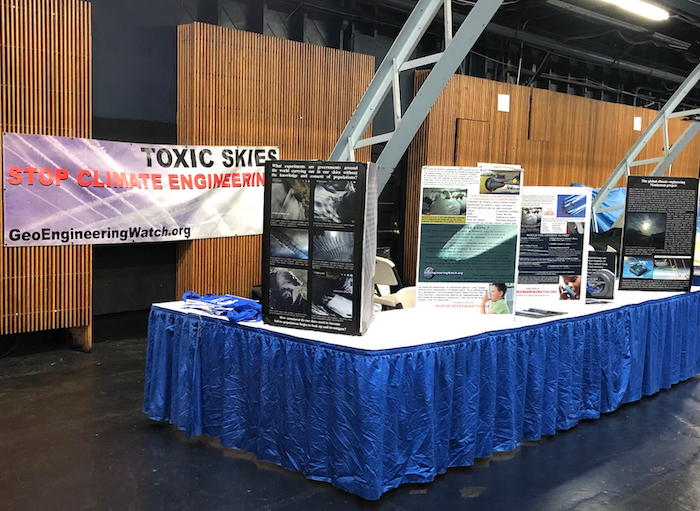
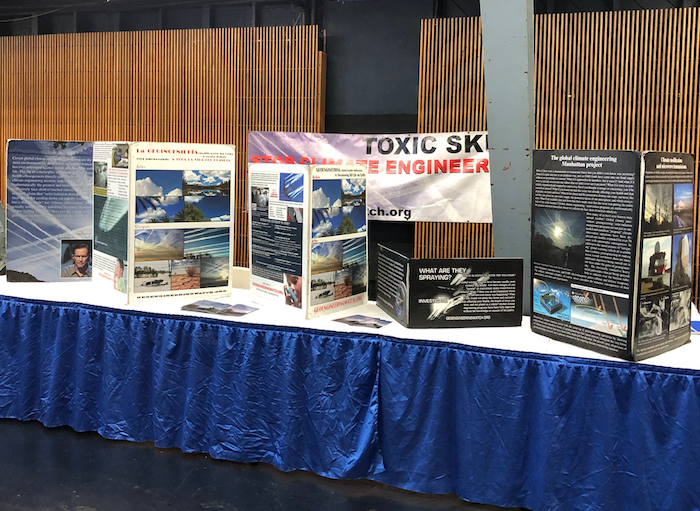
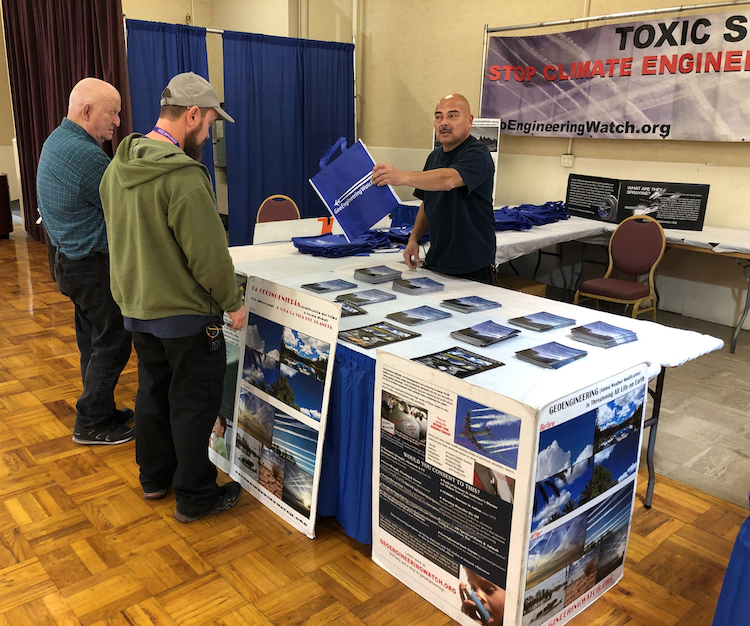
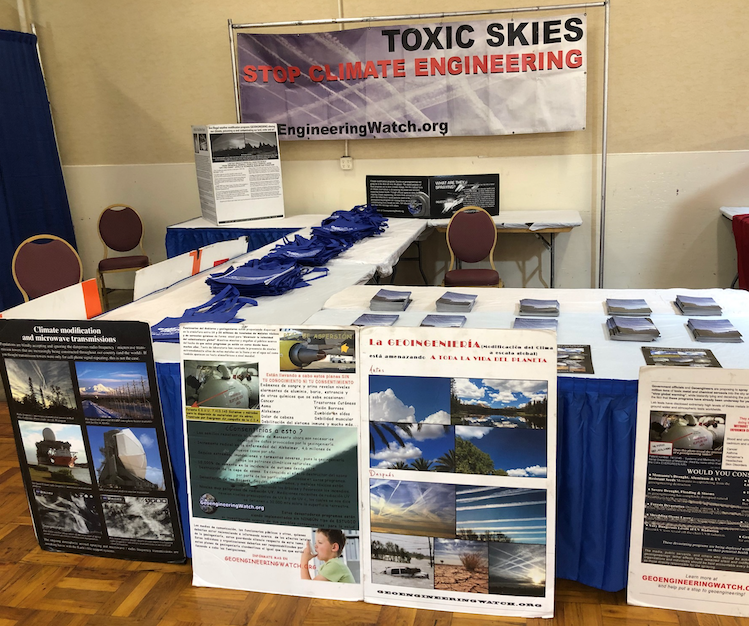
This week's GeoengineeringWatch.org outreach booth is at the Sonoma County Fairgrounds, Santa Rosa, California, and is shown below. My most sincere and continuing gratitude to the Gem Faire exhibition organizers for facilitating and setting up this very effective booth in every week's Gem Faire location. The schedule for upcoming Gem Faire events is HERE. A geoengineeringwatch.org booth will be at all events, thanks to the steadfast support of Gem Faire.
Geoengineering Watch has conducted our first ever high altitude particulate testing. Film footage of the flight and lab testing processes are featured in “The Dimming”, a groundbreaking documentary that is currently in production. This documentary film will provide answers and proof of the ongoing climate engineering / weather warfare operations. Below is a new 12+ minute insight segment on the upcoming film.
Geoengineering Watch Global Alert News, November 21, 2020, #276

Dane Wigington
GeoengineeringWatch.org
The holidays are nearly upon us, complete with CV-19 and its related protocols. How is Thanksgiving going to go for the many that have been waiting in food lines, often for hours at a time? The polarization of populations is being fed by corporate media, the scripted distractions have kept the public's eyes off of the wider horizon. The rapidly accelerating meltdown of the polar regions is triggering mass methane release scenarios, especially in the Arctic. If our atmosphere becomes saturated with this highly effective heat trapping gas, how much time would we have left? How big a part has geoengineering played in all that is unfolding. The latest installment of Global Alert News is below.
Converging catastrophes are not just coming, they are here. All are needed in the critical battle to wake populations to what is coming, we must make every day count. Share credible data from a credible source, make your voice heard. Awareness raising efforts can be carried out from your own home computer.
DW
Geoengineering Watch has conducted our first ever high altitude particulate testing. Film footage of the flight and lab testing processes are featured in “The Dimming”, a groundbreaking documentary that is currently in production. This documentary film will provide answers and proof of the ongoing climate engineering / weather warfare operations. Below is a new 12+ minute insight segment on the upcoming film.
Geoengineering Watch Global Alert News, October 31, 2020, #273
Dane Wigington
GeoengineeringWatch.org
While all eyes are focused on the coming election, the covert climate engineering onslaught continues to take its toll. The New York Times has just published a new and extensive report on planetary geoengineering. Though the article has not actually admitted geoengineering programs are already ongoing, that reality is becoming all but impossible to hide. A Cornell University scientist, Dr. Douglass MacMartin, was prominently covered in the New York Times article on climate engineering. MacMartin made the following statement in the report, “we know with 100% certainty that we can cool the planet”. But do Dr. MacMartin’s “facts” hold up under scrutiny? WBAI radio, on the East Coast, hosted a live on-air debate between Dr. MacMartin and Geoengineering Watch, audio excerpts from the debate are included in this broadcast. Dire news on unfolding mass methane expulsion is coming in from the Arctic, a scenario which climate engineering is making worse overall, not better. What are the ramifications? The latest installment of Global Alert News is below.
Now more than ever, exposing and halting climate engineering is the great imperative. All are needed in the critical battle to wake populations to what is coming, we must make every day count. Share credible data from a credible source, make your voice heard. Awareness raising efforts can be carried out from your own home computer.
DW
In the live on-air debate below, Dr. Douglass MacMartin did his best to deny the ongoing climate engineering reality. But did MacMartin's stated conclusions hold up to factual scrutiny? Listeners can decide.
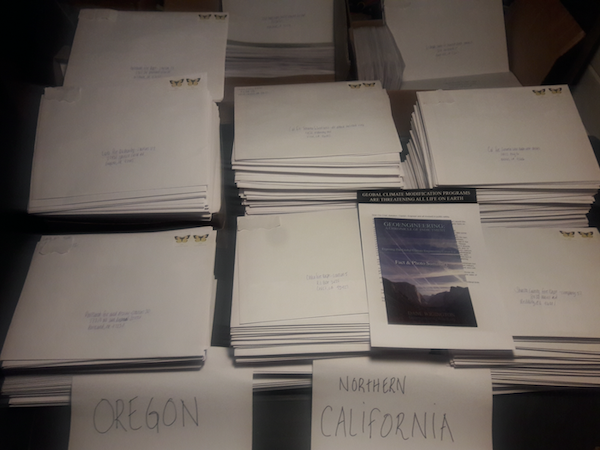
With the help of very dedicated activists in the field GeoengineeringWatch.org 20 page full color informational booklets have been mailed to nearly 1500 individual officials and agencies along the entire US West Coast.
For those that have not yet seen our recent post on “The Dimming”, it is a groundbreaking documentary that is currently in production. This documentary film will provide answers and proof of the ongoing climate engineering / weather warfare operations. Below is a 4+ minute trailer on the upcoming film.
Geoengineering Watch Global Alert News, December 21, 2019, #228
Dane Wigington
GeoengineeringWatch.org
Weather and politics are increasingly the themes of the day. Which subject poses the greatest challenge to us all? From mass methane release to acidifying seas and the planetary contamination of microplastics, how many dire issues are mainstream media sources hiding from the population? Industrialized civilization has strip mined countless terrestrial regions, our oceans are now the target for what will be the largest and most destructive mining operations of all. How much longer can the planet sustain the damage being carried out against it? The latest installment of Global Alert News is below.
Though the challenges looming on our collective horizon are immense and many, climate engineering is the greatest and most immediate challenge we face short of nuclear cataclysm.
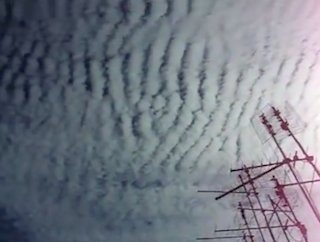
When was the first time you noticed the change in our skies? This shocking half minute video reveals blatant climate engineering operations in the Northwest region of the Netherlands. Video footage credit: John G.
Collectively we can yet make a difference for the better. Reaching a critical mass of awareness in the population is the only path toward altering our current course of certain near term demise. Share credible data from a credible source, make your voice heard.
DW
This photo was taken at Nature's Market in Kent, Washington. Geoengineering Watch wishes to express our gratitude to the owners of Nature's Market, and to Larry and Kathy Burns for their help with encouraging this outreach effort.

This week's GeoengineeringWatch.org outreach booth is at the Scottish Rite Event Center, San Diego, California, and is shown below. My most sincere and continuing gratitude to the Gem Faire exhibition organizers for facilitating and setting up this very effective booth in every week's Gem Faire location. The schedule for upcoming Gem Faire events is HERE. A geoengineeringwatch.org booth will be at all events, thanks to the steadfast support of Gem Faire.
US EPA Scientist Fired For Trying To Tell The Truth About Climate Engineering And Fluoridated Water
Dane Wigington
GeoengineeringWatch.org
The public has been trained and conditioned to believe that federal agencies like the EPA exist to watch over them and warn them of any potential dangers. This notion could not be further from the truth. Though there are honest and caring people within these agencies (like the scientist who has drafted the statement below), the institutions as a whole exist to hide threats from the population, not to disclose them. The majority of the public continues to convince themselves that if there was really anything they should be concerned about, someone, somewhere, in some federal public protection agency would tell them. The statement below should be a sobering wake-up call for us all. It is yet another confirmation of all that has been stated above. From global geoengineering, to Fukushima, to toxic fluoridated water and lethal vaccinations, the public health and the health of our biosphere is being decimated. Where are the official warnings from official agencies? The truth continues to be hidden by the government agencies that are tasked with hiding it.
Michael Davis is now a former EPA scientist who is working with GeoengineeringWatch.org in an effort to get the truth out, his full resume is at the bottom of this article. Michael was recently terminated from the EPA for daring to tell the truth about two extremely dire public dangers, the highly toxic fallout from climate engineering, and the willful contamination of the public water supply with industrial waste. I had the pleasure and honor of working with Michael for over a year, he has participated in conference calls directly with the Geoengineering Watch legal team. Upon being terminated from the EPA, I asked Mr. Davis if he would draft a statement for GeoengineeringWatch.org, that statement is below.
A Statement For GeoengineeringWatch.org From Scientist Michael Davis
My name is Michael Davis, I was employed as an Environmental Engineer for nearly 16 years in the National Pollution Discharge Elimination Systems (NPDES) Programs Branch of the Water Division in Region 5, Chicago of the USEPA. I was terminated as a public servant performing a public service for raising the issues of anthropogenic deposition of aluminum due to atmospheric geoengineering.
Geoengineered skies, Woodland, Michigan. Photo credit: Kacy Blair
In addition, I brought up the industrial hazardous waste byproduct of fluoride known as HFSA (being sold primarily by the phosphate fertilizer and aluminum industries) to drinking water utilities for disposal into the nation's drinking water systems. This does not include pollutants that are discharged from wastewater reclamation facilities into receiving waters.
The issue regarding anthropogenic deposition of aluminum due to atmospheric geoengineering came up in May 2013 when a colleague in the NPDES Programs Branch sent a general email to everyone regarding "NPDES and Climate Change". I sent a six (6) bullet point one – sentence response to my colleague. Nearly six (6) weeks later my supervisor (at the time) set up a conference call to inform me that I would be receiving a Letter of Reprimand for making false, malicious and unfounded statements against colleagues, supervisors, management and elected public servants. Furthermore, my then supervisor claimed that my statements damaged the integrity and reputation of the agency.
In April, 2014, my last supervisor assigned me to the Beloit, Wisconsin wastewater reclamation facility DRAFT permit review. I asked the permit writer why fluoride (a poison) was be disposed of in Beloit's drinking water supply? She could not provide an explanation. Approximately two (2) weeks later my supervisor placed a "gag order" on me barring me from having any communication written or verbal with anyone unless he approved ahead of time and was present on all conference calls. It was claimed by my supervisor (and management) that the "gag order" would remain in place to prevent me from making statements that would further damage the integrity and reputation of the agency.
Furthermore, my supervisor kept giving me assignments like Beloit, Wisconsin where fluoride, along with other pollutants knowing that I would describe the adverse human, animal health effects along with adverse environmental effects of them in my DRAFT Permit review reports. The adverse human, animal and environmental effects were completely ignored by my supervisor. This was even more profound when it came to the issue of fluoride as HFSA being deposited into the drinking water system. This is in violation of (1) EPA's Policy on Scientific Integrity, (2) The Precautionary Principle, (3) 5 U.S.C. §2302(b)(8) and (4) Informed Consent. My supervisor informed me that the EPA does not regulate fluoride in the drinking water systems under either the Clean Water Act (CWA) or the Safe Drinking Water Act (SDWA). However, FDA under Health and Human Services (HHS) regulated fluoride in the drinking water systems.
I eventually crafted a general description of the adverse human and animal health effects in an email to my supervisor and upper level management. Initially was ignored by all of them. I had to send the original descriptive email several times over about a six (6) month period of time before I received a reply from the water division director who just parroted the corporate agenda pertaining to fluoride disposal into the nation's drinking water systems.
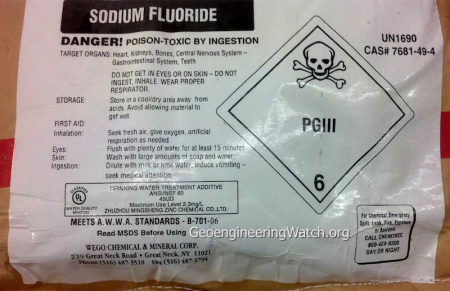
The label in the photo above should be shocking to any that are even slightly awake. Highly toxic industrial waste that is officially labeled as a "drinking water additive".
In doing my own research into the issue of anthropogenic deposition of aluminum from atmospheric geoengineering (as well as fluoride and other pollutants) in an attempt to determine why there was strong opposition from my supervisor and the EPA in general it this (factual reports on the issues). It is because the EPA wants to continue their cover-up, collusion, and criminality pertaining to pollution and contamination being perpetrated by their puppet masters, the multinational corporations. The EPA (like the FDA, CDC, etc) is a complete sham. Because the "P" in EPA stands for protection of corporate profits and not for protecting human, animal and environmental (or biosphere) health. The EPA like other governmental regulatory agencies are corrupt to the core, completely dysfunctional and have been completely hijacked by the multinational corporations.
I will not allow any of my ex – supervisors, ex – branch chiefs, ex – divisions directors, ex – EPA acting regional administrator or ex – EPA administrator or other individuals either identified or unidentified to get away contaminating our one and only biosphere (soil, water and air), and causing untold adverse human and animal health effects.
The threats we collectively face are immense and grave. These existential threats are being hidden from public view by government agencies which are completely controlled by a criminal power structure that operates in the shadows with impunity. Those who serve public protection agencies must find the courage to stand up and speak out as Michael Davis has. Others (in the same agencies), who have committed themselves to being shameless tyrannical order followers, must be exposed and held accountable, legally and morally. The battle before us to fully expose the truth requires our full commitment. Each of us is needed, all can make a difference. All can and must make their voices heard in the fight for the greater good, we are rapidly running out of time. My deepest respect and regard for the courage and concern for the greater good that Michael Davis has shown.
DW
Michael Davis resume is below:
OBJECTIVE
To obtain a engineering position in the water/wastewater/alternative energy sector.
SUMMARY OF QUALIFICATIONS
- Solid training and education in chemical/mechanical engineering both supported by Bachelors and Masters degrees with concentration in thermal sciences relating to kinetics, fluid mechanics, heat transfer, and thermodynamics, as well as combustion, pollution and energy control types of engineering analysis.
- Knowledge of solar engineering, thermal radiation, air pollution, heat transfer, and advanced engineering mathematics.
- Research and design experience that has been applied to laboratory testing for fluidized bed, char analysis, ash analysis, and air pollution analysis in the development of pulse combustors.
- Substantial background in procurement for mechanical design.
- Excellent problem solver combing a high degree of innovation and follow-through.
PROFESSIONAL EXPERIENCE
2001-2016 U.S. ENVIRONMENTAL PROTECTION AGENCY, Chicago, Illinois
Environmental Engineer
- Performed engineering review of multiple million dollar grant proposals.
- Performed technical reviews of wastewater treatment plant and pretreatment draft permits.
- Special assignments.
2000 NORTH DAKOTA STATE UNIVERSITY, Mechanical Engineering and Applied Mechanics, Fargo, North Dakota
Laboratory Instructor for Mechanical Systems I (M.E. 455) & II (M.E. 456)
1999 ROLLS ROYCE ALLISON ENGINE COMPANY, Indianapolis, Indiana
Summer Industrial Fellowship Advanced Gas Turbine Systems Research (AGTSR)
- Performed an empirical heat conduction analysis on the inner and outer bands of the first stage vane doublets with and without Thermal Barrier Coatings (TBC).
- Performed further empirical analysis on different film cooling hole patterns on the inner and outer bands, as well as, the design and manufacturing aspects on introducing these film cooling holes.
- Continued an extended analysis on hot streak on the second stage vanes and how to suppress this hot streak by introduction of film cooling holes on the transition duct.
- Having my analysis interpreted in performance of both turbine and engine found that it was in good agreement with only a slight increase in combustor temperature was needed in order to maintain the performance power of the 501 industrial engine.
1998 ROLLS ROYCE ALLISON ENGINE COMPANY, Indianapolis, Indiana
Summer Industrial Fellowship Advanced Gas Turbine Systems Research (AGTSR)
- Performed an empirical heat transfer analysis on the first stage compressor wheel, which was comprised of an exotic material.
1996-1999 UNIVERSITY OF NORTH DAKOTA, Mechanical Engineering Department, Grand Forks, North Dakota
Graduate Teaching Assistant
EDUCATION
-
UNIVERSITY OF NORTH DAKOTA, Grand Forks, North Dakota
Masters in Mechanical Engineering (2000)
Independent Study: “The Influence of Turbulence Level, Scale, Wake Effects, Surface Roughness, Body Shape and Leading Edge Effects on Stagnation Region Heat Transfer.” -
CALIFORNIA STATE UNIVERSITY, LONG BEACH, Long Beach, California
Master in Chemical Engineering (1995)
Directed Research Project: “Study of the Use of Intermediate Reboilers and Condensers for Industrial Distillation Systems.” -
CALIFORNIA STATE UNIVERSITY, LONG BEACH, Long Beach, California
Bachelors in Chemical Engineering (1994)
Senior Design Project: Plant design for methanol synthesis from methane gas for Fluor Daniel, Inc., Irvine, California (Project duration = 12 months).
GRADUATE PAPERS
- Authored: “Transport Phenomena in Bioprocess System (Sludge)” (Spring 1994).
- Co-authored: “Design of a Solar Water Heater” (Fall 1994).
- Project: “Comparison of Plate Radiation Using 3-Node and 7-Node Method” (Fall 1994).
PROFESSIONAL AFFILIATIONS
Inducted into Tau Beta Pi Engineering Honor Society
Member, Water Environment Federation (WEF)
May be freely reprinted, so long as the text is unaltered, all hyperlinks are left intact, and credit for the article is prominently given to GeoengineeringWatch.org and the article’s author with a hyperlink back to the original story.
Geoengineering Watch Global Alert News, March 2, 2019, #186

Dane Wigington
GeoengineeringWatch.org
Our world continues to change at a pace that exponentially exceeds anything ever documented in the entire history of the planet. Completely unsustainable artificial realities are keeping huge segments of population pacified for the moment, even while the rumors of global conflict grow. What is unfolding won’t seem real until it is. The latest installment of Global Alert News is below.
Engineering winter weather is one of the primary objectives for the geoengineers. By manipulating upper level wind currents and with patented processes of chemical ice nucleation for weather modification, the climate engineers are (and have been) cooling down the most populated regions of the US (backed by the most massive military industrial complex on the planet). This process fuels the continued confusion and division of the population in regard to the true state of the global climate. Much of the cooler air is, in essence, robbed from the Arctic by jet stream manipulation via ionosphere heater installations. What happens then? The most recent departure from normal high temperature map below paints a clear picture. The total meltdown of the Arctic accelerates, as does the mass methane releases occurring there from the increased heat buildup. If enough formerly frozen methane hydrate deposits release into the atmosphere, it will very soon be game over. This is not to blame all of our challenges on climate engineering, but mathematically speaking, it is the single greatest climate disrupting factor at this time. The dark red zones on the polar regions are a harbinger of a very grave future for us all (and then there is the collapsing ozone layer to consider, in which climate engineering is also a primary causal factor).

Departure from normal high temperature map
Attempting to make a difference for the better is a personal decision, it is a choice. No matter how great the odds are against us, we are not beaten until we decide to be so. If we stand together in the dedicated and relentless effort to sound the alarm and to awaken global populations, we may yet accomplish profound good. If we can expose climate engineering, we could stop it. If we can stop it, we would at least buy time. All of us are needed to do our part, share credible data from a credible source, make your voice heard.
DW
This week's GeoengineeringWatch.org outreach booth is at the Del Mar Fairgrounds, Del Mar, California, and is shown below. My most sincere and continuing gratitude to the Gem Faire exhibition organizers for facilitating and setting up this very effective booth in every week's Gem Faire location. The schedule for upcoming Gem Faire events is HERE. A geoengineeringwatch.org booth will be at all events, thanks to the steadfast support of Gem Faire.
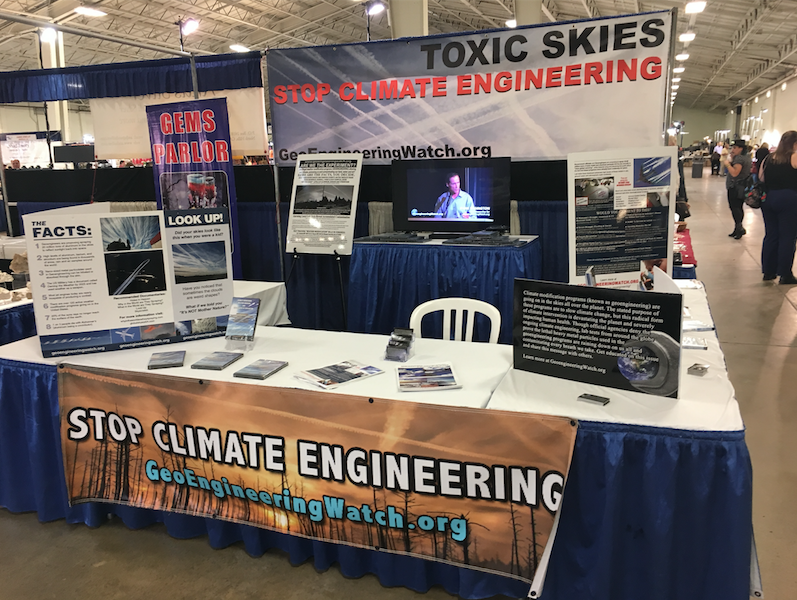
Will the blatant grid patterns in our skies compel populations to look up and take notice? The 1 minute video below was captured along the Eastern Sierra, California. Video footage credit: Athina Kaviris
Geoengineering Watch Global Alert News, September 22, 2018, #163

Dane Wigington
GeoengineeringWatch.org
From all over the world the headlines continue to pour in, change is occurring at blinding speed. As our forests and wildlife disappear, instead of planting trees, so called “civilized” nations are building yet more weapons of mass destruction. As devastatingly high levels of methane fill the atmosphere, industry is given the green light to unleash even more. A new science study has now determined past planetary extinctions occurred “instantaneously” on a geologic time scale. The current mass extinction is statistically occurring at least 170 times faster. Where does that leave us? The latest installment of Global Alert News is below.
Given the gravity of the rapidly accelerating environmental and climate collapse, what should our personal priorities be at this moment in time? Giving up is not an option. Rather, now more than ever, we must collectively give our all in the critical effort to wake others from our individual circles. We should encourage those who wake to do the same. Share credible data from a credible source, make every day count.
DW
This week's GeoengineeringWatch.org outreach booth is at the Mountain America Exposition Center, Salt Lake City, Utah, and is shown below. My most sincere and continuing gratitude to the Gem Faire exhibition organizers for facilitating and setting up this very effective booth in every week's Gem Faire location. The schedule for upcoming Gem Faire events is HERE. A geoengineeringwatch.org booth will be at all events, thanks to the steadfast support of Gem Faire.
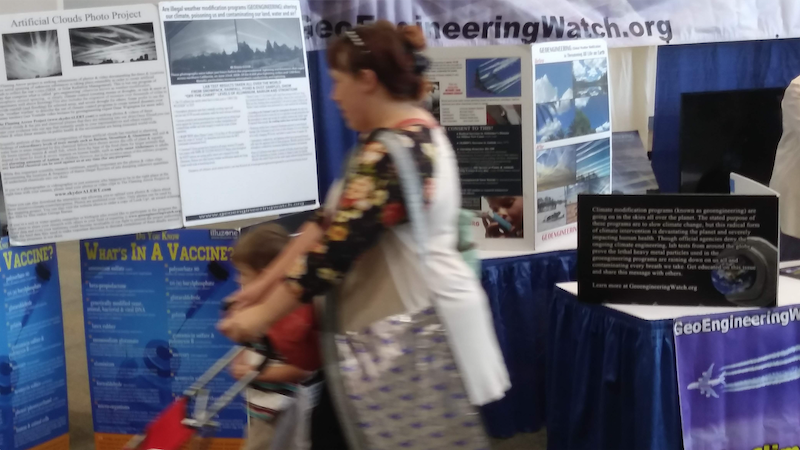
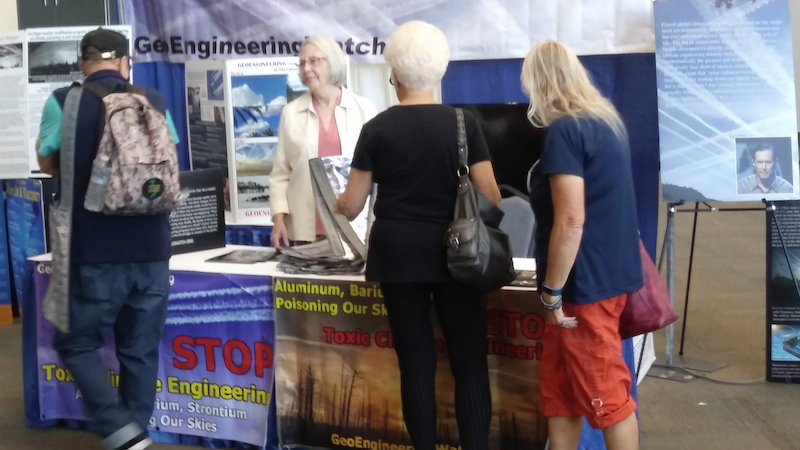
Interview: EPA Scientist Sounds The Alarm On Geoengineering Contamination
Dane Wigington
GeoengineeringWatch.org
Among the legions of immoral, bought and paid for order followers that now fill the halls of government agencies, there are still some with the courage to tell the truth no matter what the cost. In the attached interview with former EPA scientist Michael Davis, the true criminality of organizations like the EPA is exposed from a first hand account. Michael was fired for attempting to expose the threats posed by climate engineering and fluoride contamination.
A Statement For GeoengineeringWatch.org From Scientist Michael Davis
My name is Michael Davis, I was employed as an Environmental Engineer for nearly 16 years in the National Pollution Discharge Elimination Systems (NPDES) Programs Branch of the Water Division in Region 5, Chicago of the USEPA. I was terminated as a public servant performing a public service for raising the issues of anthropogenic deposition of aluminum due to atmospheric geoengineering.
The interview below reveals how EPA scientist Michael Davis was fired from his post for attempting to disclose very dire public threats.
Morally bankrupt “public protection” agencies are actually used to hide grave threats from the public, not to disclose them.
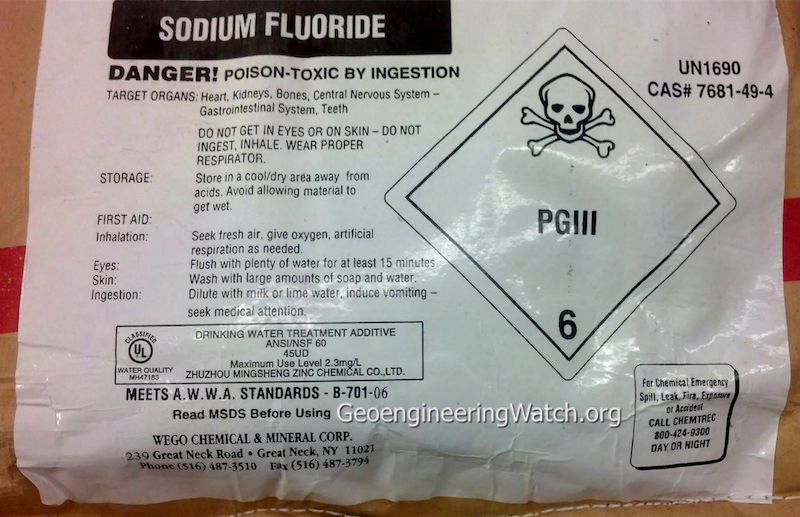
The label in the photo above should be shocking to any that are even slightly awake. Highly toxic industrial waste is officially labeled as a "drinking water additive".
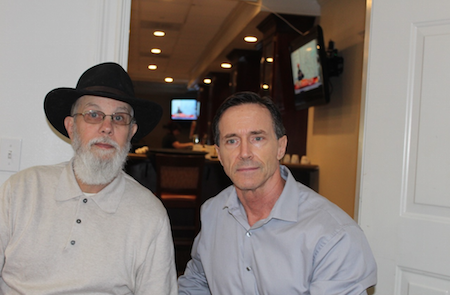
EPA scientist / whistleblower Michael Davis (left) was a scheduled speaker at the July 28th event that was canceled due to the Carr Fire, Michael also attended the round-table meeting.
The gravity and immediacy of the dangers we collectively face (which have been systematically hidden from public view) cannot be overstated. If we have any chance of changing course, the effort will take all of us. Sharing credible data from a credible source is key, make your voice heard.
DW
Michael Davis resume is below:
OBJECTIVE
To obtain a engineering position in the water/wastewater/alternative energy sector.
SUMMARY OF QUALIFICATIONS
- Solid training and education in chemical/mechanical engineering both supported by Bachelors and Masters degrees with concentration in thermal sciences relating to kinetics, fluid mechanics, heat transfer, and thermodynamics, as well as combustion, pollution and energy control types of engineering analysis.
- Knowledge of solar engineering, thermal radiation, air pollution, heat transfer, and advanced engineering mathematics.
- Research and design experience that has been applied to laboratory testing for fluidized bed, char analysis, ash analysis, and air pollution analysis in the development of pulse combustors.
- Substantial background in procurement for mechanical design.
- Excellent problem solver combing a high degree of innovation and follow-through.
PROFESSIONAL EXPERIENCE
2001-2016 U.S. ENVIRONMENTAL PROTECTION AGENCY, Chicago, Illinois
Environmental Engineer
- Performed engineering review of multiple million dollar grant proposals.
- Performed technical reviews of wastewater treatment plant and pretreatment draft permits.
- Special assignments.
2000 NORTH DAKOTA STATE UNIVERSITY, Mechanical Engineering and Applied Mechanics, Fargo, North Dakota
Laboratory Instructor for Mechanical Systems I (M.E. 455) & II (M.E. 456)
1999 ROLLS ROYCE ALLISON ENGINE COMPANY, Indianapolis, Indiana
Summer Industrial Fellowship Advanced Gas Turbine Systems Research (AGTSR)
- Performed an empirical heat conduction analysis on the inner and outer bands of the first stage vane doublets with and without Thermal Barrier Coatings (TBC).
- Performed further empirical analysis on different film cooling hole patterns on the inner and outer bands, as well as, the design and manufacturing aspects on introducing these film cooling holes.
- Continued an extended analysis on hot streak on the second stage vanes and how to suppress this hot streak by introduction of film cooling holes on the transition duct.
- Having my analysis interpreted in performance of both turbine and engine found that it was in good agreement with only a slight increase in combustor temperature was needed in order to maintain the performance power of the 501 industrial engine.
1998 ROLLS ROYCE ALLISON ENGINE COMPANY, Indianapolis, Indiana
Summer Industrial Fellowship Advanced Gas Turbine Systems Research (AGTSR)
- Performed an empirical heat transfer analysis on the first stage compressor wheel, which was comprised of an exotic material.
1996-1999 UNIVERSITY OF NORTH DAKOTA, Mechanical Engineering Department, Grand Forks, North Dakota
Graduate Teaching Assistant
EDUCATION
-
UNIVERSITY OF NORTH DAKOTA, Grand Forks, North Dakota
Masters in Mechanical Engineering (2000)
Independent Study: “The Influence of Turbulence Level, Scale, Wake Effects, Surface Roughness, Body Shape and Leading Edge Effects on Stagnation Region Heat Transfer.” -
CALIFORNIA STATE UNIVERSITY, LONG BEACH, Long Beach, California
Master in Chemical Engineering (1995)
Directed Research Project: “Study of the Use of Intermediate Reboilers and Condensers for Industrial Distillation Systems.” -
CALIFORNIA STATE UNIVERSITY, LONG BEACH, Long Beach, California
Bachelors in Chemical Engineering (1994)
Senior Design Project: Plant design for methanol synthesis from methane gas for Fluor Daniel, Inc., Irvine, California (Project duration = 12 months).
GRADUATE PAPERS
- Authored: “Transport Phenomena in Bioprocess System (Sludge)” (Spring 1994).
- Co-authored: “Design of a Solar Water Heater” (Fall 1994).
- Project: “Comparison of Plate Radiation Using 3-Node and 7-Node Method” (Fall 1994).
PROFESSIONAL AFFILIATIONS
Inducted into Tau Beta Pi Engineering Honor Society
Member, Water Environment Federation (WEF)
May be freely reprinted, so long as the text is unaltered, all hyperlinks are left intact, and credit for the article is prominently given to GeoengineeringWatch.org and the article’s author with a hyperlink back to the original story.
Geoengineering Watch Global Alert News, June 2, 2018, #147
Dane Wigington
GeoengineeringWatch.org
Our government continues to do anything they want to the climate, and the planet as a whole. The push to saturate the biosphere with highly destructive 5G transmissions is the most recent alarming example. 5G frequencies are also used for crowd control. Is the power structure preparing for what they certainly know is inevitable? Unfolding global chaos? Mass methane release from numerous locations around the globe are also a rapidly growing existential threat. We are again being warned about new pathogens being released from thawing permafrost. Are these bio-threats really coming from nature? Processes have been set in motion that cannot just be turned off, the equations we collectively face on countless fronts has long since gone exponential. As resources dwindle, and populations are forced to face reality, the current paradigm will shift. The latest installment of Global Alert News is below.
What was, will not be for much longer. Power structures around the globe are advancing their agendas by the day. Can these agendas, and the decimation they are causing, be exposed and halted in time to salvage anything? The answer to that question may yet depend on our collective actions, or inactions. What will our priorities be? How many will add their voices to the effort of waking the masses?
DW
This week's GeoengineeringWatch.org outreach booth is at the Expo Square, Tulsa, Oklahoma, and is shown below. My most sincere and continuing gratitude to the Gem Faire exhibition organizers for facilitating and setting up this very effective booth in every week's Gem Faire location. The schedule for upcoming Gem Faire events is HERE. A geoengineeringwatch.org booth will be at all events, thanks to the steadfast support of Gem Faire.


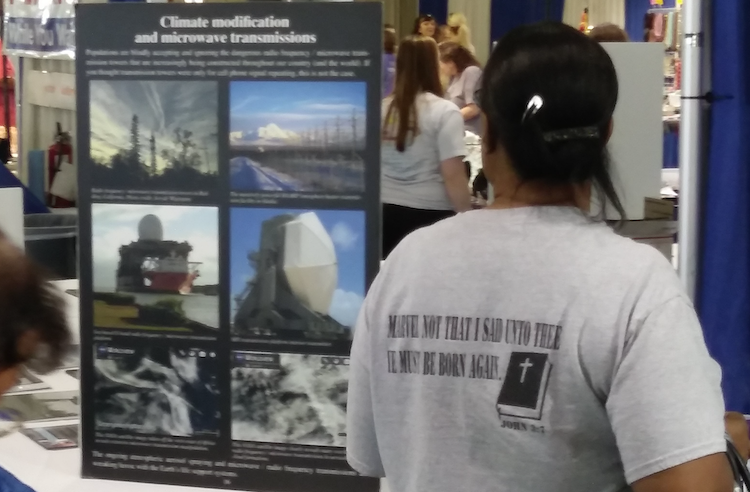
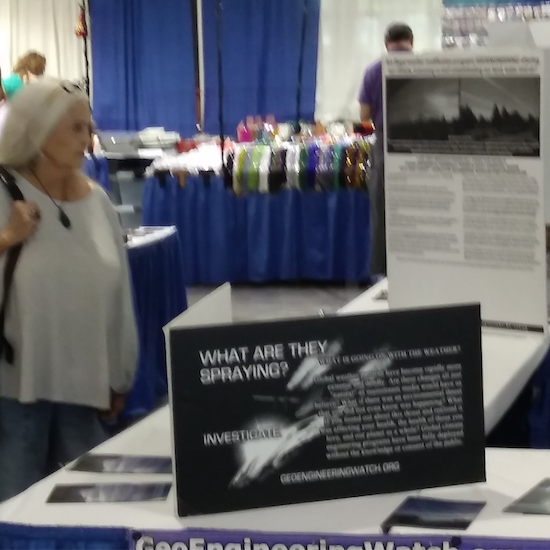
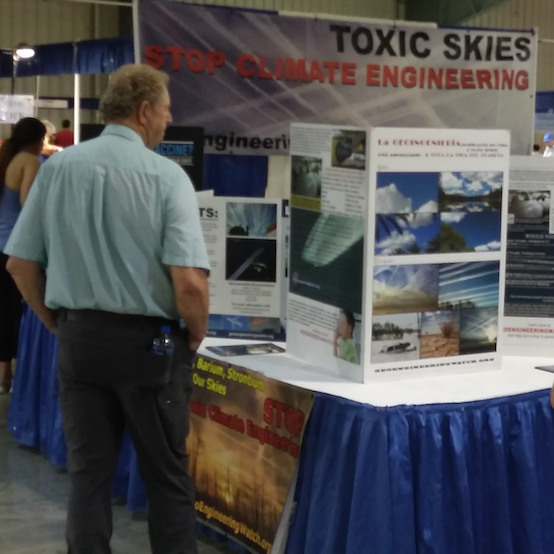
Our thanks to Mike Torrence for continuing with his efforts to raise awareness at the Tonasket farmer's market in Washington State (5/31/18).
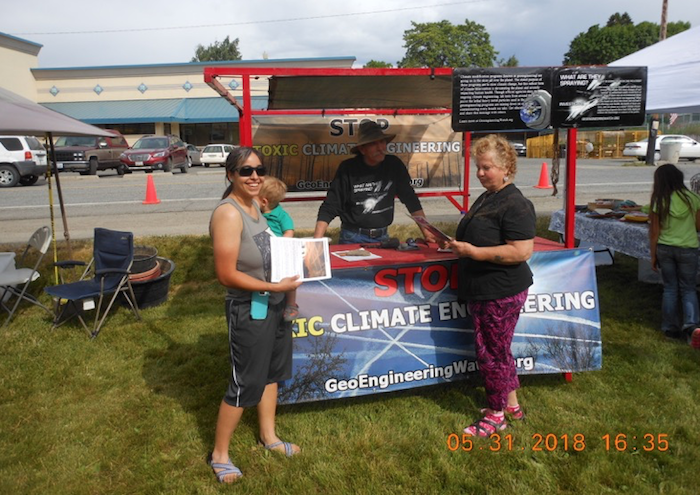
Two new billboards have just been put up on (5/28/18) on Hwy 1, at the western gate of Yoho National Park and Banff National Park, just outside of Golden, British Columbia, Canada. These are the last billboards before a 1.5 hr drive to the historic town of Banff. Our deepest and most sincere gratitude to Jason and Lorna Hardy for making this happen. The link on the second billboard, LookUpBC.com, leads to GeoengineeringWatch.org
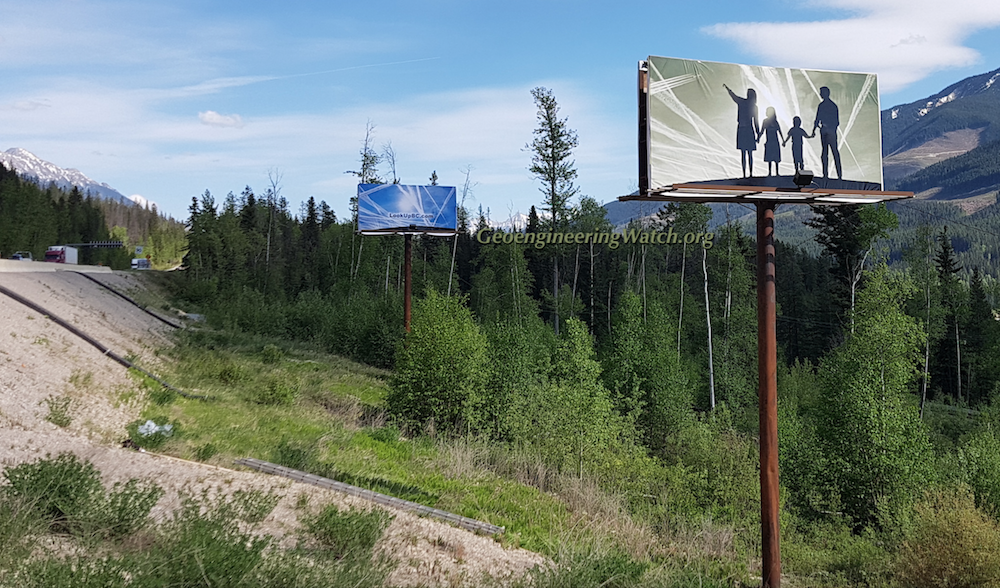

Global Weather Modification Assault Causing Climate Chaos And Environmental Catastrophe
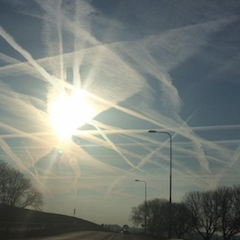
Dane Wigington
geoengineeringwatch.org
Global climate engineering encompasses many different aspects and processes. The consequences of the climate engineering insanity are already unquantifiable and growing by the day. Though each aspect of this subject is more than enough for an in depth article, there is often a need for more of an overall summary to pass on to those that are not aware of the broader picture.
What Major Factor Causing "Climate Change" Are They Not Telling Us About?
More alarming articles and studies are surfacing each day which confirm the rapidly changing state of Earth's life support systems and climate. Humanity has decimated the planet in countless ways and the repercussions are becoming catastrophic. Though there are certainly many parts to this unfolding story, the largest piece of the puzzle by far still goes completely unacknowledged by the entire scientific community and all of the main stream media / corporate / military / industrial complex. The massive elephant in the room has been, and still is, "stratospheric aerosol geoengineering" (SAG), AKA "solar radiation management" (SRM).


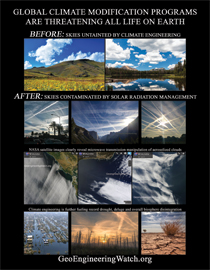


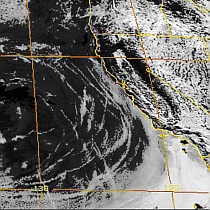


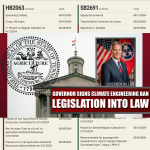
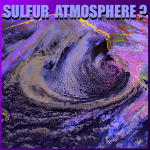
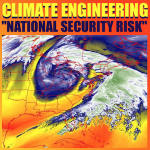


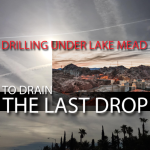


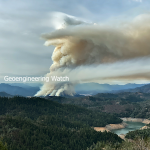
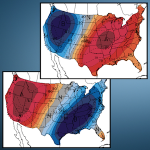
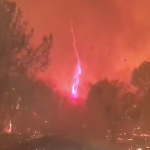
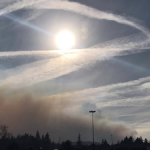

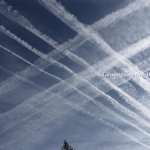


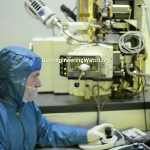


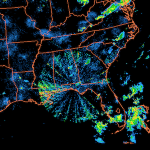


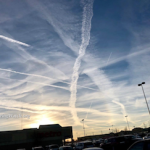


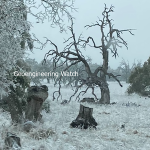


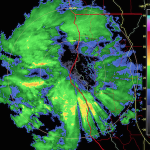
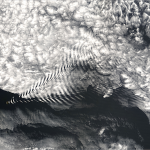


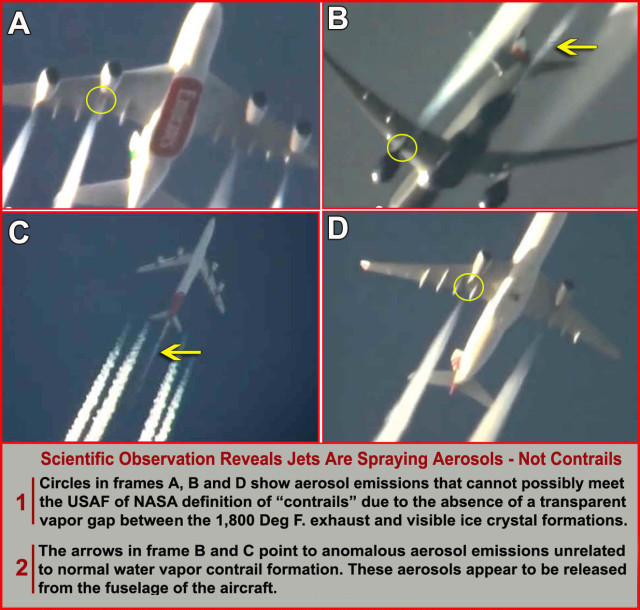


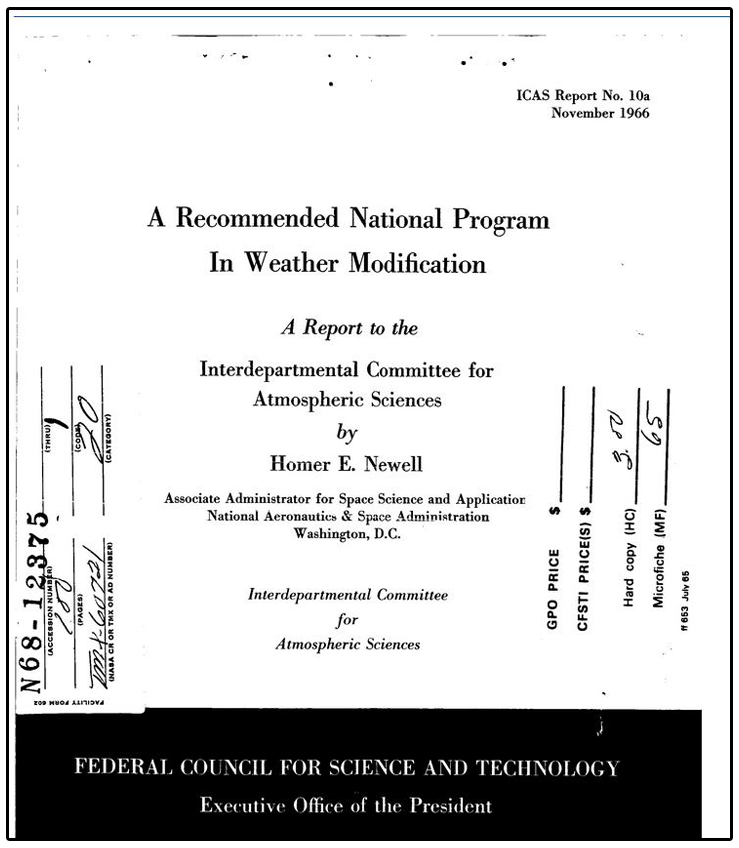

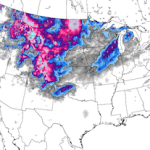
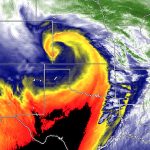
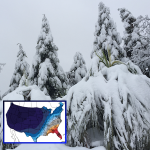
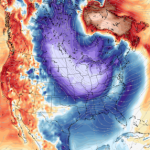
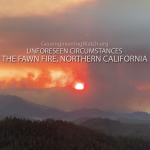


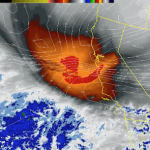
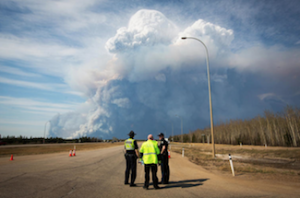


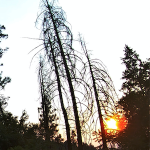


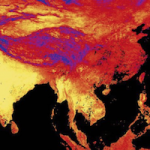
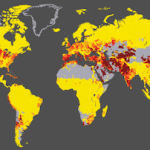

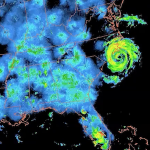
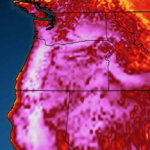

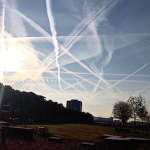

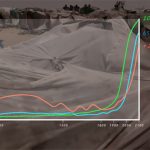

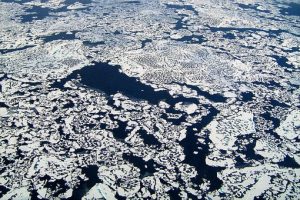
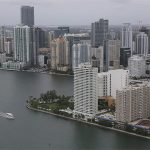
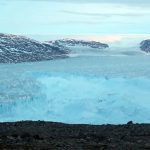

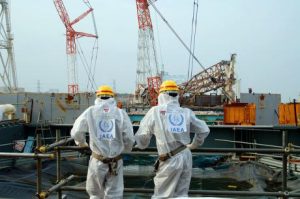
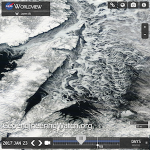


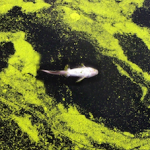
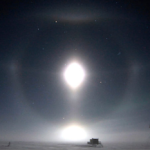
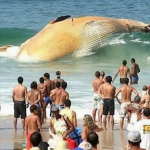

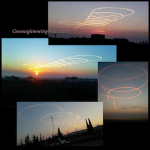

