
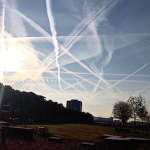
Geoengineering, And Our Warming Planet, (No, It’s Not Getting Colder)
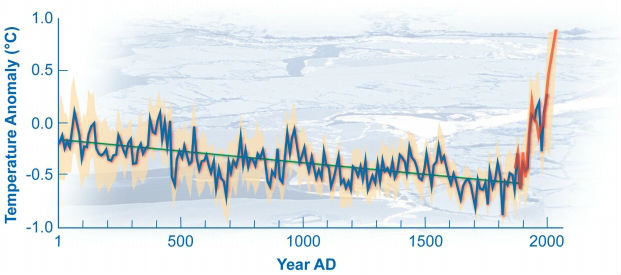

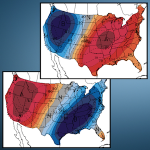
The Earth was cooling until the start of the industrial revolution. This would be expected as the planet is in the elliptical phase of its orbit. The graphs below speak for themselves.
Those who still believe the planet is undergoing overall cooling today should do serious research and take the time to do a thorough examination of the rapidly unfolding data on the ground.
This is not about Al Gore or carbon credits, both are shams, rather, it’s about harsh realities. The human race has done great damage to the planet and the climate overall. All available data indicates that the single largest factor in the climate change equation is geoengineering, and it is being completely kept out of view by the corporate / military / media / industrial complex.
It is imperative geoengineering be stopped. The planet is in full blown meltdown and geoengineering is helping to fuel the fire. Changes are occurring so rapidly at this point that I believe it will be difficult for those in power to hide the weather/climate altering programs for much longer. We will see.
It appears increasingly likely that governments around the globe will try to sell geoengineering as a saving measure for the planet when they can no longer hide it. It is imperative to educate a significant percentage of the population on the subject of geoengineering and the utter decimation it is causing before such a PR campaign takes place in order to keep geoengineering from being publicly accepted as a “cure”.
Indeed the geoengineers can create short term large scale cooling, but it appears at the cost of a far worsened overall warming.
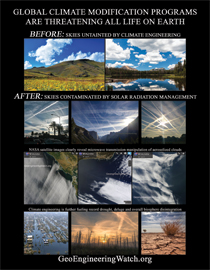
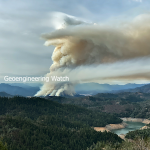
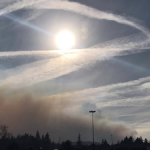
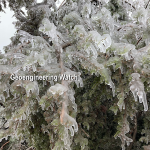
Geoengineering is shredding the ozone layer. This allows much more of the sun’s thermal energy to reach the surface of our planet. The bioavailable heavy metals from the spraying is literally killing the forests, the lungs of the planet. Waters, soils, and every breath we take is now tainted with the fallout from these covert climate altering programs.
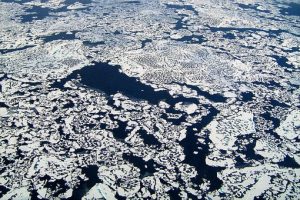
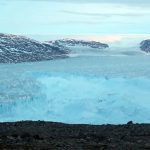
The Arctic ice cap is imploding. We will likely have an ice free Arctic during summer in the next few years. A year round ice free Arctic will follow a few years after. The ramifications from this are many and very dire.
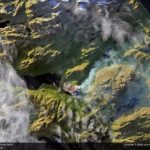
Ongoing geoengineering has also changed wind currents, which in turn has altered ocean currents. These changed currents now push warm waters into the Arctic which have helped to thaw methane hydrates on the sea floor.
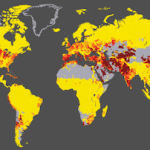
The global methane image at the bottom should be the most dire “wake up” call of all the charts below. The atmosphere is being saturated with methane which is over 100 times more potent a greenhouse gas than Co2 over a ten year time horizon. It is like covering the planet with a sheet of glass.
The vast majority of peer reviewed science data indicates that the Earth’s climate has already been significantly compromised, and is becoming less hospitable to life at a very rapid pace. If geoengineering is not stopped, and Earth is not allowed to respond on its own without the complete hindrance of the lethally toxic climate altering geoengineering / chemtrail assault, our horizon looks dim indeed.
All are needed in the effort to expose global geoengineering. It’s up to each and every one of us.
Dane Wigington

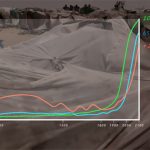
The image below (by Kinnard et al. 2011) shows a reconstructed history of late-summer Arctic sea ice extent over the period AD 561–1995.
Ice extent has continued to decrease dramatically since 1995.

Below are the figures for recent years.
Year of September Average Extent Extent (million sq. km)
2002 5.96
2003 6.15
2004 6.04
2005 5.57
2006 5.89
2007 4.28
2008 4.67
2009 5.36
2010 4.90
2011 4.61
September Average Extents, 2002-2011, National Snow and Ice Data Center NSIDC
The rate at which Arctic sea ice is disappearing becomes even more evident when also looking at ice volume.

Above chart, by Wipneus based on PIOMAS data, shows the dramatic loss of Arctic sea ice. The feedback effects from the disappearing sea ice will make the situation a lot worse. The biggest danger is that large amounts of methane will be released rather abruptly from hydrates in the Arctic.
The Methane threat
In 2011, methane levels globally reached 1820 ppb in Mauna Loa, Hawaii, while nitrous oxide levels (another potent greenhouse gas) reached 325 ppb.


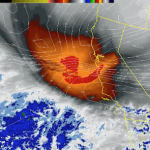
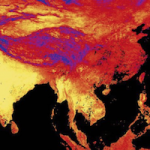
The Arctic experiences even higher levels of methane, as illustrated below.

Particularly worrying is that, in the past, methane concentrations have fluctuated up and down in line with the seasons. Over the past seven months, however, methane has shown steady growth in the Arctic. Such a long continuous period of growth is unprecedented, the more so as it takes place in winter, when vegetation growth and algae bloom is minimal. The most obvious conclusion is that the methane is venting from hydrates.

How much methane is there in the Arctic?
Some 1700 Gt of organic carbon is contained in terrestrial permafrost stores. This is projected to result in emissions of 30 – 63 Gt of Carbon by 2040, reaching 232 – 380 Gt by 2100 and 549 – 865 Gt by 2300. These figures are carbon dioxide equivalents, combining the effect of carbon released both as carbon dioxide (97.3%) and as methane (2.7%), with almost half the effect likely to be from methane.
In addition to these terrestrial stores, there is methane in the oceans and in sediments below the seafloor. More than 99.9% of the organic carbon in Earth’s crust is located in sedimentary basins, which have biological, inorganic and clastic deposits totaling 15,000,000 Gt of carbon. To put these numbers into perspective, the IPCC in TAR estimated cumulative carbon emissions associated with carbon dioxide at a level of 450ppm at 670GtC.
All charts and graphs from arcticnewsblogspot


Leave a Reply