


Source: Arctic News
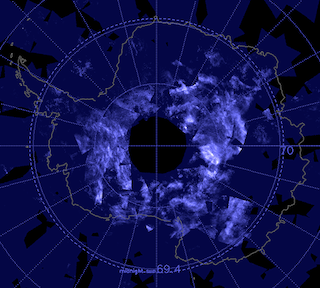
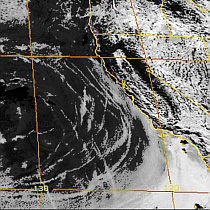
For some time, Arctic sea ice extent has again been at a record low for the time of the year. The image below shows Arctic sea ice extent on October 26, 2016, when extent was only 6.801 million km².

One reason for the low sea ice extent is the high and rising temperature of the Arctic Ocean. On October 27, 2016, the Arctic Ocean was as warm as 14.8°C or 58.6°F (green circle near Svalbard), 12.1°C or 21.7°F warmer than 1981-2011, as the image below shows.

On October 29, 2016, the Arctic Ocean was as warm as 14.9°C or 58.8°F (green circle near Svalbard), 12.1°C or 21.8°F warmer than 1981-2011, as the image below shows.

As the sea ice shrinks, less sunlight gets reflected back into space, while more open water and higher sea surface temperatures also cause storms and cyclones to become stronger. Stronger cyclones also cause greater amounts of water vapor to move up the Pacific Ocean and the Atlantic Ocean toward the Arctic.
|
|


Less Arctic sea ice and a warmer Arctic Ocean make that more heat and water vapor gets transferred from the Arctic Ocean to the atmosphere. The two above images show temperature forecasts for November 1 & 2, 2016. In both cases, temperatures over the Arctic as a whole are forecast to be as much as 6.40°C higher than 1979-2000.
As these images show, temperature anomalies in many places are at the top end of the scale, i.e. +20°C or +36°F.

Above combination image shows record low Arctic sea ice for the time of the year (left) and near record low Antarctic sea ice for the time of the year (right), with a combined sea ice extent of only 23.751 million km² on October 28, 2016. In other words, the world is now absorbing a lot of sunlight that was previously reflected back into space.
Below are two further temperature forecast:

Above image shows forecasts for October 31, 2016. The Arctic is forecast to be 6.07°C warmer than 1979-2000, while the Antarctic is forecast to be 4.56°C warmer than 1979-2000.

Above image shows forecasts for November 1, 2016. The Arctic is forecast to be 6.42°C warer than 1979-2000, while the Antarctic is forecast to be 3.70°C warmer than 1979-2000.
Rising temperatures over the Arctic further contribute to a rise in the amount of water vapor in the air over the Arctic at a rate of 7% more water vapor for every 1°C warming. Since water vapor is a potent greenhouse gas, more water vapor further accelerates warming in the Arctic.
The Climate Reanalyzer image below shows the temperature rise in the Arctic over time.

In the video below, Dr. Walt Meier of NASA Goddard Space Flight Center describes how the Arctic has been losing its thicker and older sea ice over the years (1991 to September 2016).
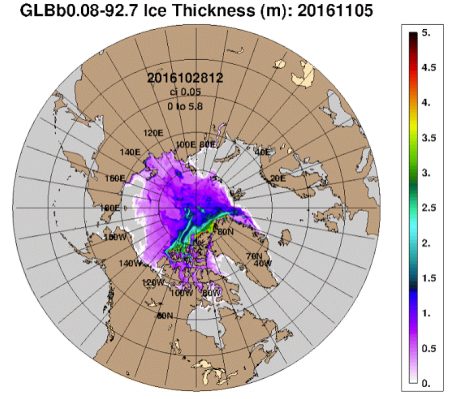
The Naval Research Lab 30-day thickness animation below (up to October 28, 2016, with forecasts up to November 5, 2016) further shows minimal recent growth of the Arctic sea ice, especially in terms of the ice with a thickness of 1m or above.

As the Arctic Ocean gets warmer, the danger grows that large amounts of methane will erupt from destabilizing hydrates at its seafloor. Ominously, high methane levels are visible over the Arctic on the image below, showing methane levels as high as 2424 ppb on October 24, 2016.

The animation below, made with images from another satellite (and a different scale), shows high methane levels over th Arctic Ocean from October 26 to 28, 2016.