


Source: Arctic News
Temperature Rise
A temperature rise (from preindustrial levels) of more than 10°C (18°F) could eventuate by the year 2026, as illustrated by the image below and as discussed in an earlier post.
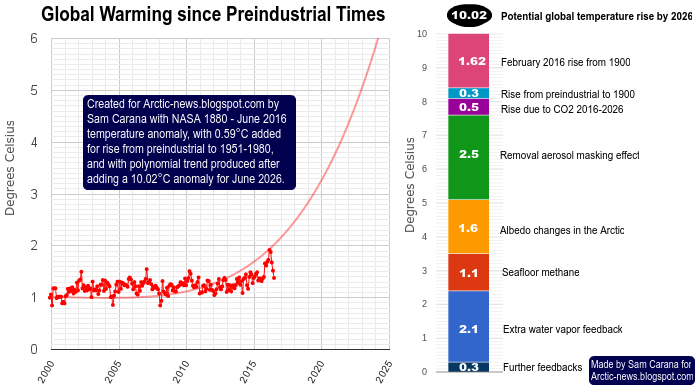
The high temperature anomaly that occurred in February 2016 was partly caused by El Niño. Nonetheless, there is a threat that the February 2016 anomaly was not a peak, but instead was part of a trend that points at what is yet to come.
Ocean Heat
As the image below shows, 93.4% of global warming goes into oceans. Accordingly, ocean heat has been rising rapidly and, as the image below shows, a trend points at a huge rise over the coming decade.
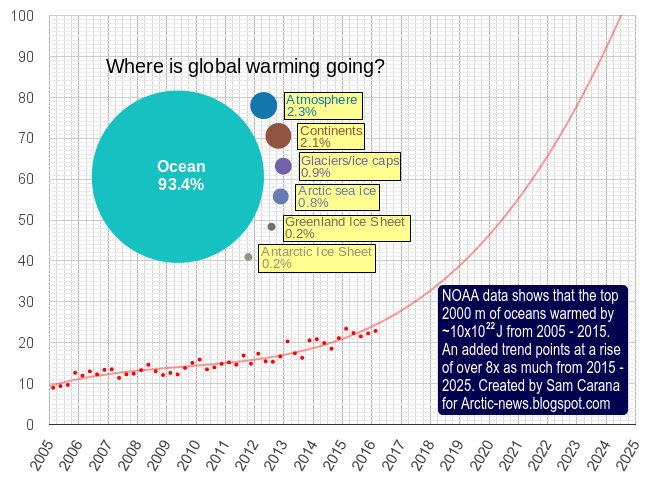
Ocean temperature rise affects the climate in multiple ways. A recent study confirmed earlier fears that future increases in ocean temperature will result in reduced storage of carbon dioxide by oceans.
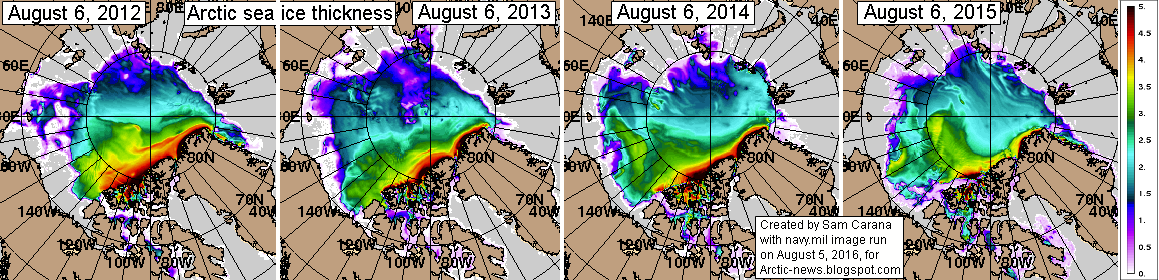
Arctic Sea Ice Thickness & Volume

|
| [ click on images to enlarge] |
Importantly, ocean temperature rises will also cause Arctic sea ice to shrink, resulting in albedo changes that will make that less sunlight gets reflected back into space, and more sunlight instead gets absorbed by the Arctic Ocean.
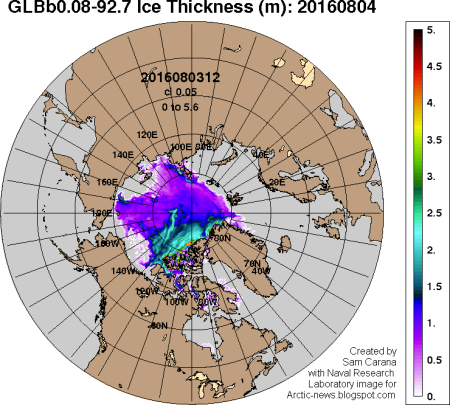
Arctic sea ice is losing thickness rapidly. The image on the right shows that the thicker sea ice is now almost gone (image shows sea ice on August 6, 2016, nowcast). The image below gives a comparison of the years 2012, 2013, 2014 and 2015 for August 6.
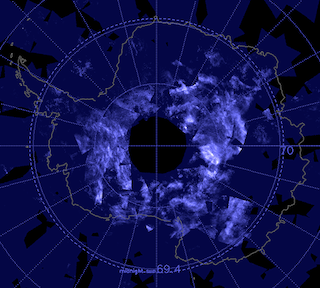
The situation looks even more threatening when looking at the Naval Research Laboratory image below, produced with a new model and run on August 3, 2016, valid for August 4, 2016.

The image below, by Jim Pettit, shows Arctic sea ice volume.

|
| animated version of this graph |
Sea Surface Temperatures

|
| [ click on images to enlarge ] |
The Arctic Ocean is feeling the heat carried in by the Gulf Stream. The image on the right shows sea surface temperature anomalies from 1971-2000.
Note that the anomalies are reaching the top of the scale, so in some areas they will be above that top end (i.e. 4°C or 7.2°F) of the scale.
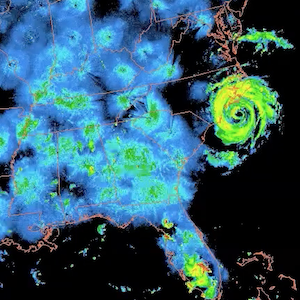
Sea surface temperatures off the coast of North America are very high, with anomalies reaching as high as 33.1°C, as the image below shows. Much of the heat accumulating in the Gulf will be carried by the Gulf Stream to the Arctic Ocean over the coming months.


The image on the right shows Arctic sea surface temperature anomalies on August 7, 2016, as compared to 1961-1990. Note the black areas where sea surface temperature anomalies are above 8°C.
Similarly, the image below shows global sea surface temperature anomalies.
Note that sea surface temperatures in the Arctic Ocean will remain around freezing point as long as there is sea ice present. Once the sea ice is gone, though, surface temperature will rise rapidly.

Sea surface temperature was as high as 18.1°C or 64.6°F close to Svalbard (green circle) on August 6, 2016, 13.1°C or 23.6°F warmer than in 1981-2011, which gives an idea of the ocean heat underneath the sea surface.

Methane
There's a danger that, as the temperature of the Arctic Ocean keeps rising, huge amounts of methane will enter the atmosphere due to destabilization of hydrates at its seafloor.
Source: Arctic News