


Research was published this week showing the financial cost of methane being released from Earth’s permafrosts. But the risks go beyond financial – Earth’s history shows that releasing these stores could set off a series of events with calamitous consequences.
By Andrew Glikson Arctic News
A satellite picture reveals permafrost melting around Liverpool Bay in Canada’s northwest territories. NASA Goddard Space Flight Center
The sediments and bottom water beneath the world’s shallow oceans and lakes contain vast amounts of greenhouse gases: methane hydrates and methane clathrates (see Figure 1). In particular methane is concentrated in Arctic permafrost where the accumulation of organic matter in frozen soils covers about 24% of northern hemisphere continents (see Figure 2a) and is estimated to contain more than 900 billion tons of carbon.
Methane, a greenhouse gas more than 30 times more potent than CO2, is released from previously frozen soils when organic matter thaws and decomposes under anaerobic conditions (that is, without oxygen present).
Most of the current permafrost formed during or since the last ice age and can extend down to depths of more than 700 meters in parts of northern Siberia and Canada. Thawing of part of the permafrost has not yet been accounted for in climate projections.
The Siberian permafrost is in particular danger. A large region called the Yedoma could undergo runaway decomposition once it starts to melt. This is because elevated temperatures cause microbes in the soil to decompose, which causes heat, which creates a self-amplifying process.
 |
| Figure 1: Global distribution of methane hydrate deposits on the ocean floor. Naval Research Laboratory |
Palaeoclimate studies of stalagmite cave deposits across Siberia indicate they grew faster during the warm periods 424,000 and 374,000 years ago, due to permafrost melt. At that time, mean global temperatures rose by approximately 1.5 degrees Celsius above pre-industrial temperatures. Thus Vaks et al state: “Growth at that time indicates that global climates only slightly warmer than today are sufficient to thaw extensive regions of permafrost.”
Evidence of melting of permafrost has also been reported from the dry valleys of Antarctica, where development of thermokarst (small surface hummocks formed as ice-rich permafrost thaws) has been reported, reaching a rate about 10 times that of the last ~10,000 years.
The mean temperature of the continents has already increased by about 1.5C. With sulphur aerosols masking some of the warming, the real figure may be closer to 2C.
 |
| Figure 2a: Vulnerable carbon sinks. CSIRO Global Carbon Project |
 |
| Figure 2b: Global average abundances of carbon dioxide and methane 1978-2011 |
Arctic air temperatures are expected to increase at roughly twice the global rate. A global temperature increase of 3C means a 6C rise in the Arctic, resulting in an irreversible loss of anywhere between 30 to 85% of near-surface permafrost. According to the United Nations, warming permafrost could emit 43 to 135 billion ton CO2 (GtCO2) equivalent by 2100, and 246 to 415 GtCO2 by 2200.
The geologically unprecedented rate of CO2 rise (~2.75 ppm/year during June 2012-2013) may result in faster permafrost collapse.
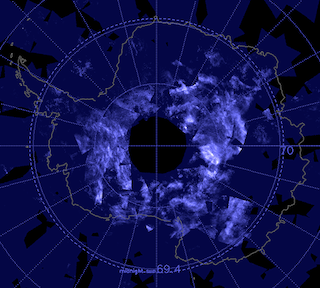
Already measurements along the Siberian shelf uncover enhanced methane release. In 2010 a Russian marine survey conducted more than 5000 observations of dissolved methane showing that more than 80% of East Siberian shelf bottom waters and more than 50% of surface waters are supersaturated with methane. Atmospheric methane levels (during glacial periods: 300–400 parts per billion; during interglacial periods: 600–700 ppb) have recently reached 1850 ppb – the highest in 400,000 years (see Figure 2b).
Hansen et al estimate that the rise of CO2 forcing between 1750 and 2007 has already committed the atmosphere to between +2 and +3 degrees Celsius, currently mitigated in part by sulphur aerosols.
 |
| Figure 3: Change in average annual land surface temperature since 1750. Berkeley Temperatures |
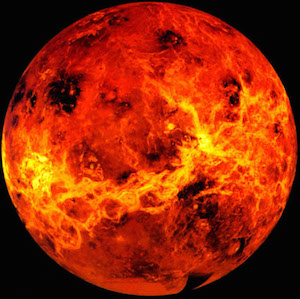
Hansen refers to the “Venus Syndrome”, drawing an analogy between the enrichment of Venus’ atmosphere in CO2 (its atmosphere is 96.5% CO2 and its surface temperature is 462C) and potential terrestrial runaway greenhouse effects. This needs to be placed in context.
On Earth, weathering processes and oceans draw down the bulk of atmospheric CO2 to be deposited as carbonates. It’s therefore impossible for Earth to develop Venus-like conditions. But the onset of a hyperthermal – a huge release of carbon such as happened during the Paleocene-Eocene Thermal Maximum 55 million years ago, with an attendant mass extinction of species – is possible.
 |
| Figure 4. Estimates of fossil fuel resources and equivalent atmospheric CO2 levels, including (1) emissions to date; (2) estimated reserves, and (3) recoverable resources (1 ppm CO2 ~ 2.12 GtC). Hansen, 2012, figure 1; http://www.columbia.edu/~jeh1/mailings/2012/20120127_CowardsPart1.pdf |
Extraction and combustion of the current fossil fuel reserves (more than 20,000 billion tonnes of carbon – Figure 4) would inevitably lead to a hyperthermal commensurate with or exceeding the PETM. If that happens, CO2 would rise to above 500ppm (see figure 4), temperature would rise by about 5C (figure 5) and the polar ice sheets would melt – it’s a future we could face if emissions continue to accelerate.
 |
| Figure 5: Growth in CO2 and CO2 equivalent (CO2+CH4) during the Pleistocene and the Holocene. IPCC AR4 |
Not that the above features too much in the Australian elections, where the reality of climate change has been replaced with pseudoscience notions, including by some who have not consulted basic climate science text books, and by hip-pocket-nerve terms such as “carbon tax”, “emission trading scheme” or “direct action”. The proposed 5% reduction in emissions relative to the year 2000 represent no more than climate window dressing.
Nor are coal exports mentioned too often, despite current exports and planned future exports, which represent carbon emissions tracking toward an order of magnitude higher than local emissions.
According to Dr Adam Lucas of the Science and Technology Studies Program at University of Wollongong, Australia (with ~0.3% of the global population) currently contributes domestic emissions of about 1.8% of global emissions. The total domestic and overseas consumption of Australian coal is responsible for more than 2% of global emissions. Plans to triple or even quadruple coal export volumes over the next 10 years would raise Australia’s total contribution to global GHG emissions to toward 9% to 11% by 2020 – an order of magnitude commensurate with that of Middle East oil.
Which places the “Great moral challenge of our generation” in perspective.
Andrew Glikson does not work for, consult to, own shares in or receive funding from any company or organisation that would benefit from this article, and has no relevant affiliations.
![]()
This article was originally published at The Conversation.
Read the original article.
Warm water keeps flowing into the Kara Sea
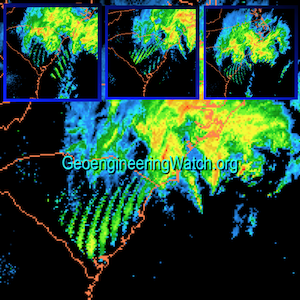
The image below, from methanetracker.org, shows methane levels at 1950 and higher in yellow, for the period of July 17 to July 23, 2013.
 |
| [ click on image to enlarge ] |
The temperature map below, for July 26, 2013, from Wunderground, shows that high temperatures are still prominent in Russia, at much the same location where most of the methane in above image shows up.

High temperatures warm up the water flowing into the Kara Sea, as shown on the image below for July 26, 2013, from the Danish Meteorological Institute.

Wednesday, July 24, 2013
Arctic Methane Release: “Economic Time Bomb”
On March 19, 2013, a number of experts came together for an Ecorys.com workshop, as part of a
 |
| Peter Wadhams Sc.D., Prof. of Ocean Physics and head of the Polar Ocean Physics group, Cambridge University. |
study examining the impact of a 50-Gt release of methane from the melting permafrost at the East Siberian Arctic Shelf (ESAS) over different time periods, ranging from one to five decades.
Back in 2008, a study by Natalia Shakhova et al. considered release of up to 50 Gt of predicted amount of hydrate storage as highly possible for abrupt release at any time.
In order to estimate the cost of such a release, this new study used a more recent version of the model used in the renowned Stern Report. Findings of the study are published in the journal Nature. The conclusion is that such a release from the ESAS alone comes – in the absence of mitigating action – with a price tag of $60 trillion. By comparison, the size of the world economy in 2012 was about $70 trillion.
Such a methane pulse will “bring forward 15–35 years the average date at which the global mean temperature rise exceeds 2°C above pre-industrial levels”, says the paper.
“The economic consequences will be distributed around the globe, but the modelling shows that about 80% of them will occur in the poorer economies of Africa, Asia and South America. The extra methane magnifies flooding of low-lying areas, extreme heat stress, droughts and storms.”
“The total cost of Arctic change will be much higher,” says the paper. To find out the actual cost, more feedbacks should be incorporated in the model, such as linking the extent of Arctic ice to increases in Arctic mean temperature. The full impacts of a warming Arctic include, for example, ocean acidification and altered ocean and atmospheric circulation. “Midlatitude economies such as those in Europe and the United States could be threatened, for example, by a suggested link between sea-ice retreat and the strength and position of the jet stream, bringing extreme winter and spring weather. Unusual positioning of the jet stream over the Atlantic is thought to have caused this year’s protracted cold spell in Europe.”
Comments & Responses
Meanwhile [July 27, ed.], the piece in Nature has received wide news coverage, including a critique by Jason Samenow in the Washington Post. Peter Wadhams responds to some of the comments as follows:
Peter Wadhams: The 25 July post by Jason Samenow on the global economic impacts of methane emissions in the East Siberian Sea portrays the findings of our research as misleading, a statement with which I strongly disagree. Our work is based on a prediction of the magnitude and timing of methane emissions from the thawing of Arctic offshore permafrost by a scientist who has done extensive field work on this part of the ocean bed and is a globally recognized expert. We calculated the financial implications of these emissions for the world economy over a century and also considered the effect of the emissions on increasing overall global warming, obtaining a 0.6C figure by 2040. We rightly consider these to be substantial figures, which deserve wide circulation among climate scientists, and Nature and its referees agreed with us.
In our analysis we showed that the overall cost of a given volume of methane release is relatively insensitive to the rate of release or, within limits, its timing, BUT that the cost is roughly proportional to the overall volume of release. Thus, even if you worked with a different projection by a lesser qualified scientist than Shakhova, and revised down the figure and scale of the 60 trillion dollars accordingly, I suspect the cost will still be substantial – and that is one clear finding: The planetary cost of Arctic warming far outstrips any possible benefits to shipping or natural resource exploration.
In support of its skepticism about methane emissions the article quoted authors who wrote before the enormous retreat of summer Arctic sea ice and its oceanographic effects became so evident. The mechanism which is causing the observed mass of rising methane plumes in the East Siberian Sea is itself unprecedented and the scientists who dismissed the idea of extensive methane release in earlier research were simply not aware of the new mechanism that is causing it.
What is happening is that the summer sea ice now retreats so far, and for so long each summer, that there is a substantial ice-free season over the Siberian shelf, sufficient for solar irradiance to warm the surface water by a significant amount – up to 7C according to satellite data. That warming extends the 50 m or so to the seabed because we are dealing with only a polar surface water layer here (over the shelves the Arctic Ocean structure is one-layer rather than three layers) and the surface warming is mixed down by wave-induced mixing because the extensive open water permits large fetches. So long as some ice persisted on the shelf, the water mass was held to about 0C in summer because any further heat content in the water column was used for melting the ice underside. But once the ice disappears, as it has done, the temperature of the water can rise significantly, and the heat content reaching the seabed can melt the frozen sediments at a rate that was never before possible.
The 2008 US Climate Change Science Program report needs to be seen in this context. Equally, David Archer’s 2010 comment that “so far no one has seen or proposed a mechanism to make that (a catastrophic methane release) happen” was not informed by the Semiletov/Shakhova field experiments and the mechanism described above. Carolyn Rupple’s review of 2011 equally does not reflect awareness of this new mechanism.
Therefore I robustly defend our research and commentary, and hope that rather than dismiss the substantial risk such a methane release poses, the response might be to support more intensive research on this problem.
Also noteworthy is what Nathan Currier said in response to comments by Gavin Schmidt, quoted in the New York Times:
Gavin Schmidt: Threshold releases even 1/10 as large as postulated would be clear in ice cores. There is nothing there. In more recent past, there have been a number of times when Arctic (not necessarily globe) has been significantly warmer than today. Most recently, Early Holocene, which had significantly less summer sea ice than even 2012. Earlier, Eemian 125kyrs ago was significantly warmer.
Nathan Currier: I find Gavin Schmidt’s points here very thin. Let’s review them:
First, clearly no one is suggesting that during the 800,000 year period covered by ice cores there has been any such release. Further, David Archer, quoted in Revkin’s piece and a leading authority on such issues, has specifically discussed the possibility in a peer-reviewed paper (Archer, 2007) of fern diffusion allowing a Gt-scale release to escape detection in ice cores.
The problem with this argument, made repeatedly when this same issue erupted over a year ago, is that it is looking weaker than it did just a year ago: for example, we are learning that certain key ocean currents were significantly different during the Eemian than they are today – see http://phys.org/news/2012-06-climate-cold-arctic-eemian.html. And what counts in this argument is what the sea bottom conditions are, of course, not just the surface conditions. Schmidt is right that at times it was much warmer than today in the arctic, possibly 8C warmer, as we have seen from the Lake E work, but he forgets himself, and points to the early Holocene, although the area in question was a frozen piece of land at that time, not an underwater shelf, so that is purely irrelevant, as it took almost 4,000 years before the area in question became inundated.
But risks are growing significantly in the arctic by the year, and a 5Gt release, which would double the atmospheric burden, would result from less than 1% – about .7% – of estimated ESAS free gas below the hydrate layer being released, without any hydrate needing to be involved, which some kind of endogenous seismic event could conceivably set off, perhaps a sediment pile mud slide around the Lena mouth, for example. The point of the paper, lost in all of this, was just to say, this would cost us about $6 trillion.
The worst moment of Schmidt’s points, one which really merits censure, is to refer to all the research being done in the area (he clearly means Shakhova and Semiletov here) as “one off surveys.” Note that he isn’t even asking for better research to be done there, either. I personally find that quite unfortunate, even a bit embarrassing for someone who has built up a sterling reputation.
He (Schmidt) is certainly right that there is no recent example of CH4 being higher than the pre-industrial baseline, and that includes the “super-interglacials” from Lake E bores, but it is incredibly unwise to jump to the claim from that that we are not near dramatic releases without offering any evidence at all.
It is far better to go by the best peer-reviewed research about contemporary conditions on the ground than to speculate about the few generalities we can draw from the sketch of climates past we have put together for the last few million years, as valuable as that sketch is. There was at no time during that period anything like the 400ppm of CO2 in the atmosphere now, nor the many other GHGs levels we have boosted, nor the things that have no natural analogue like the CFCs, nor is there any analogue for the rate of change we have experienced, and so the sea level’s relationship to the atmospheric conditions has no analogue either, and we are also learning at the same time just how sensitive and variable key arctic ocean currents might be in this region.
All that said, Schmidt acknowledges that “potential for Arctic CH4 to have threshold behavior is real,” and I should also acknowledge that I agree that the 50Gt scenario is not likely at this time.
Let’s also add a quote from an earlier post:
Sam Carana: Analysis of sediment cores collected in 2009 from under ice-covered Lake El’gygytgyn in the northeast Russian Arctic suggest that, last time the level of carbon dioxide in the atmosphere was about as high as it is today (roughly 3.5 to 2 million years ago), regional precipitation was three times higher and summer temperatures were about 15 to 16 degrees Celsius (59 to 61 degrees Fahrenheit), or about 8 degrees Celsius (14.4 degrees Fahrenheit) warmer than today.
As temperatures rose back in history, it is likely that a lot of methane will have vented from hydrates in the Arctic, yet without causing runaway warming. Why not? The rise in temperature then is likely to have taken place slowly over many years. While on occasion this may have caused large abrupt releases of methane, the additional methane from such releases could each time be broken down within decades, also because global methane levels in the atmosphere were much lower than today.
In conclusion, the situation today is much more threatening, particularly in the East Siberian Arctic Shelf (ESAS), as further described in other posts at the methane hydrates blog.
References
– Vast costs of Arctic change, in Nature, vol 499, pp 401-403, July 25, 2013
by Gail Whiteman, Chris Hope and Peter Wadhams
http://www.nature.com/nature/journal/v499/n7459/full/499401a.html
http://www.nature.com/nature/journal/v499/n7459/pdf/499401a.pdf
– Ecorys studies economic valuation of climatic change impacts in the Arctic region
http://www.ecorys.com/news/ecorys-studies-economic-valuation-climatic-change-impacts-arctic-region
– Arctic time-bomb warning
in: Cambridge News, by Jennie Baker
http://www.cambridge-news.co.uk/Education/Universities/Arctic-time-bomb-warning-20130724123026.htm
– Anomalies of methane in the atmosphere over the East Siberian shelf: Is there any sign of methane leakage from shallow shelf hydrates?
N. Shakhova, I. Semiletov, A. Salyuk, D. Kosmach
http://www.cosis.net/abstracts/EGU2008/01526/EGU2008-A-01526.pdf
– Arctic methane release is an ‘economic time bomb’ – study
by Nafeez Ahmed
– Ice-free Arctic in two years heralds methane catastrophe – scientist
http://www.guardian.co.uk/environment/earth-insight/2013/jul/24/arctic-ice-free-methane-economy-catastropheRelated posts– How much will temperatures rise?
http://arctic-news.blogspot.com/2013/04/how-much-will-temperatures-rise.html– Runaway Global Warming
http://arctic-news.blogspot.com/2012/07/runaway-global-warming.html
Monday, July 22, 2013
Open Water at North Pole
Images from the North Pole Environmental Observatory are now showing large areas with open water at the North Pole. The image below is from Webcam 2, dated July 22, 2013.
 |
| [ click on image to enlarge ] |
Furthermore, the number of spots with methane readings of over 1950 ppb appears to be rising. See related posts below to compare. Particularly worrying are the large number of spots over the Kara Sea. Also note the spot over Greenland in the top-left corner of the image below.
 |
| [ click on image to enlarge ] |
 The webcam shows water at the North Pole. Clearly, there still is some ice underneath the water, as is evident from the stakes that have been put into the ice to indicate the depth of surface water.
Surface water can build up as a result of melting as well as due to rain.
As the image on the right shows, the ice is getting very thin. In between the North Pole and Siberia, a wide corridor has developed where the ice is between zero and one meters thick.
Surface water could extend over this corridor, all the way to edge of the ice, in which case it effectively becomes part of open water.
The presence of water in areas close to the North Pole has been discussed in a number of earlier posts, such as this one.
The image below, from the Danish Meteorological Institute, gives some idea of the extent of the sea surface temperature anomalies that have been particularly prominent in the Kara Sea for some time.

Related posts
– Watching methane over Arctic Ocean (posted July 20, 2013)
– Heat, Fires and Methane (posted July 20, 2013)
– High methane readings over Kara Sea (posted July 18, 2013)
– Methanetracker (posted July 9, 2013)
Sunday, July 21, 2013
The Great Arctic Flush
By Paul Beckwith
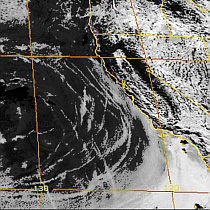
A massive cyclone is forecast to develop in the Arctic, as shown on the image below, from the Naval Research Laboratory.
Within 2 weeks the Arctic Ocean will be completely transformed. The cyclone that appears 6 days out on both the US and European ten day forecasts will massacre the sea ice in what I call “The Great Arctic flush”.

When I forecast zero sea ice at the end of the melt season this summer, I fully expected at least one or more of these massive cyclonic storms. Last year it occurred in early August, and lasted for about 8 days. In the rest of the melt season last year no other huge cyclone developed, although several small ones did. Perhaps the cyclone disturbed the ocean conditions enough to prevent subsequent ones occurring. We shall see this year…
 |
| edited screenshot from animation at weather-forecast.com |

Paul Beckwith is a part-time professor with the laboratory for paleoclimatology and climatology, department of geography, University of Ottawa. He teaches second year climatology/meteorology. His PhD research topic is “Abrupt climate change in the past and present.” He holds an M.Sc. in laser physics and a B.Eng. in engineering physics and reached the rank of chess master in a previous life.
Saturday, July 20, 2013
Watching methane over Arctic Ocean

Above image, from Wunderground.com, shows high temperatures close to the Kara Sea, where methane readings over 1950 have been recorded for some time now (see earlier posts here and here).
The image below, from Foreca and kindly provided by Albert Kallio, shows that temperatures on parts of Kara Sea and surrounding coast hit 40 degrees Celsius (or 100°F) on July 20, 2013.

The image below, also from Foreca, shows the situation on July 21, 2013, at 1:00 pm.

The NOAA image below shows sea surface temperature anomalies for July 18, 2013.

The animation below shows methane readings for July 19, 2013. High readings over the Kara Sea persist, not surprisingly, while there’s a worrying spot of methane over the East Siberian Sea and there are a number of high readings showing up over Greenland. The animation below is a 3.1 MB file, so it may take some time for it to fully load.
Heat, Fires and Methane
Here are two more images looking at links between high temperatures, fires and methane.

 |
| [ click on image to enlarge ] |


2 Responses
“Hansen refers to the “Venus Syndrome”, drawing an analogy between the enrichment of Venus’ atmosphere in CO2 (its atmosphere is 96.5% CO2 and its surface temperature is 462C) and potential terrestrial runaway greenhouse effects. This needs to be placed in context. On Earth, weathering processes and oceans draw down the bulk of atmospheric CO2 to be deposited as carbonates. It’s therefore impossible for Earth to develop Venus-like conditions”.
Not true. Atmospheric carbon-drawdown to form oceanic carbonate operates on an ~ 100,000-yr timescale. The oceans have no mechanism for coping with CO2 produced on the current sub-centennial timescale.
I know your's is an older website, perhaps the first to start sounding the alarm about Methane. From other charts and sources, I concluded we may have entered Global Thermal Runaway in 2006. Your own chart at the top of this page shows Methane beginning a new increase in level in 2006. Sadly, we may have passed the point of no return where CO2 belching not longer matters. The melting of Methane Hydrate is not only self perpetuating but increasing meaning we are now in Global Thermal Runaway. The Blob off the West Coast of America, the latest Arctic reports of a new low of ice-extent, the Russian 'potholes' are perfect confirmation of the fact the planet is now into Global Thermal Runaway. You may want to stop obscuring the facts in pages and pages of data and actually show some conclusions. We are cooked…. Since 2006. Your own charts confirm that.