
Rate Of Ocean Warming Quadrupled Since Late 20th Century, Study Reveals


Source: CarbonBrief.org
The buildup of heat-trapping greenhouse gases is warming the upper ocean four times faster than during the period 1960-1990, according to new research.
The paper, published today in the journal Science Advances, is the latest effort to piece together current and historical measurements from ships, self-propelled floats, satellites and even seals to get a global picture of how the oceans are faring under rising temperatures.
Since the 1990s, more heat is finding its way to the deep ocean and there has been no change of pace in ocean warming since 1998, compared with the previous decade, the paper notes.
The study marks a step forward, but the authors say they are concerned about the future of ocean science, given the political climate in the US. Dr John Abraham, professor of thermal sciences at the University of St Thomas in Minnesota and co-author on the paper, tells Carbon Brief:
“We are seeing dramatic cuts planned for climate science. There is every reason to expect these cuts will include ocean-sensing systems.”
Big role to play
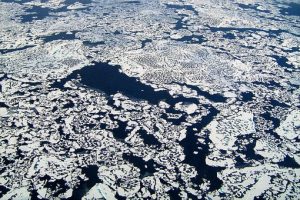
Approximately 93% of the heat captured by greenhouse gases in the atmosphere ends up in the ocean. The remaining 7% heats the atmosphere and the land, and causes ice to melt.
This means it is only by measuring the oceans that scientists can tell how fast the planet is heating and how much it will heat in the future, Abraham tells Carbon Brief:
“If you want to know about global warming, you really have to understand ocean warming.”

Credit: Rosamund Pearce, Carbon Brief.
Completing the picture
But accurately working out how quickly the oceans are warming is a difficult task, partly because of gaps in the historical data. Abraham tells Carbon Brief:
“Measuring the oceans is challenging because you need enough sensors, in enough locations, for a long enough time to get a picture of the climate.”
Early observations were typically done by commercial and scientific research ships, which means they were limited to developed countries and along shipping routes, the paper explains.
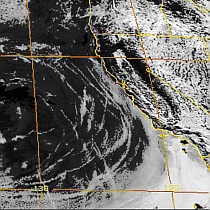
In the 1990s, the World Ocean Circulation Experiment greatly expanded the coverage of ocean temperature records. Since 1992, satellites have helped to infer ocean warming from changes in the height of the sea surface, since seawater expands as it warms.
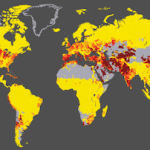
The quality of ocean measurements stepped up a gear after 2005, with the introduction of ARGO floats, a network of nearly 4,000 free-floating buoys measuring temperature in the top 2,000m of the world’s oceans.

Map showing the global coverage of the ARGO network and positions of floats that have delivered data within the last 30 days. Source: ARGO
To get a global picture of what’s happening across the huge expanse of global ocean, scientists combine measurements from the ARGO network, ship-based observation systems, buoys tethered to the seafloor and even temperature sensors attached to the heads of seals.
While there is a wealth of data post-2005, there are gaps before then that need filling in.
Scientists typically do this by making a best guess based on measurements taken at other locations nearby. The new study updates this approach, says Dr Lijing Cheng, associate professor at the Chinese Academy of Sciences and lead author on the paper. He tells Carbon Brief:
“Our study offers a new method to solve these problems.”
Instead of including stations within 800km of the missing data point, as other studies have, the authors extends this to 2,500km to account for the often greater distance between historical stations. This left fewer gaps unfilled and more ocean accounted for, the paper explains.
The authors were also able to correct for past studies that may have underestimated warming by comparing good data from the ARGO era with sparse observations for the same region taken in the 1960s or 1970s. Prof Kevin Trenberth, a senior scientist at the US National Center for Atmospheric Research and co-author on the paper, tells Carbon Brief:
“It has been amazing how much we have been able to recover in terms of information about ocean heat content from sparse past data.”
The new method left the scientists with better-than-90% coverage of the oceans from the late 1950s to 2015 and from the sea surface all the way down to a depth of 2,000m.
Warming signal
The study shows the oceans warmed relatively slowly before 1980, and faster since then. The black line in the graph below from the paper shows how the pace picks up after 1980.
The authors say in the paper that their new estimate is “somewhat greater” than previous reports, including the latest report from the Intergovernmental Panel on Climate Change (IPCC).
Dr Matt Palmer, expert in sea level and ocean heat content at the UK Met Office, who wasn’t involved in the study, tells Carbon Brief:
“The paper represents an important refinement to our estimates of ocean heat content change…While the study does not alter our basic understanding, it does suggest that IPCC AR5 reported rates of ocean warming were underestimated by about 10-15%.”
Increasingly sophisticated ways to keep tabs on the oceans allow scientists to pinpoint, not only how much heat enters the oceans, but also where it goes when it gets there.
The study shows the speed of warming in the upper ocean, between the surface and 700m, has quadrupled between 1960-1991 and 1992-2015 (slope of blue line, below). More strikingly, perhaps, the deep ocean (700-2000m) is warming nine times faster than in the 60s, 70s and 80s (red line).
, deep ocean (red) and both together (black). All figures are relative to the 1997-2005 average. Source: Cheng et al., (2017)")
Global ocean heat content from 1955 to 2015 for the upper ocean (blue), deep ocean (red) and both together (black). All figures are relative to the 1997-2005 average. Source: Cheng et al., (2017)
No slowdown
Despite what the study calls a “surge” in research into whether global temperature at the Earth’s surface slowed down temporarily in the late 90s and 2000s, the paper is clear that no such change of pace has happened in the oceans. It says:
“Our studies show that there has been no slowdown in global ocean heat content change since 1998 compared with the previous decade.”
Looking at solely surface temperature over a decade or so is not a reliable way of to track the rate of global climate change, says Palmer:
“Since ocean heat content continued to increase at a time when the rate of global surface temperature rise slowed down, we can infer that a large part of the “slowdown” must have originated from ocean heat re-arrangement.”
All ocean basins experienced significant warming since 1998, with the greatest warming in the southern oceans, the tropical/subtropical Pacific Ocean, and the tropical/subtropical Atlantic Ocean. As the paper puts it:
“The Atlantic Ocean and the southern oceans are the major new heat reservoirs (59%) even though their total area is just 48% that of the global ocean.”
Overall, about 32% of the extra heat absorbed by the ocean between 1960 and 2005 found its way to the deep ocean. Over the past decade, however, this proportion jumped to 49%, indicating that the deep ocean is playing an increasingly important role in ocean warming.
Mystery explained
Finally, the authors combined their estimate of heat taken up by the oceans between 0-2,000m with a previous estimate of warming below 2,000m.
They found a good match between changes in ocean heating and a satellite-based reconstruction of variations in the total amount of radiative energy entering and leaving the top of Earth’s atmosphere since 1985. (Compare the yellow line in the graph below with all of the different shades of blue combined.)
This means the mystery of the “missing heat” posed by Trenberth a while back is now effectively solved, suggests Palmer.
 radiative imbalance expected to enter the ocean (yellow) with estimates of the ocean heat content at different depth levels (blue shading). Source: Cheng et al., (2017)")
Proportion of the top of atmosphere (TOA) radiative imbalance expected to enter the ocean (yellow) with estimates of the ocean heat content at different depth levels (blue shading). Source: Cheng et al., (2017)
‘A travesty’
Despite the fact that ARGO floats are largely to thank for having such detailed information about the oceans, the scientists behind today’s study fear for the future of the network. Abraham tells Carbon Brief:
“I am not confident that we will have continued coverage. The current system uses state-of-the-art sensors that are spread out across the oceans…It is not clear that there will be continued funding for this absolutely crucial system in the current political climate in the US.”
The Oceanic and Atmospheric Research (OAR) programme at the National Oceanic and Atmospheric Administration (NOAA) is in line for a 26% cut, and ocean observation and ARGO come out of that budget, Trenbeth tells Carbon Brief. What’s more, many other countries provide their contributions as a percentage of the NOAA contribution, he adds:
“If NOAA cuts back so do others – and it all goes downhill…Argo is still a research enterprise, not an operational one. It is vulnerable. Such a cutback would be a travesty.”
Source: CarbonBrief.org


No matter how much information and hard line data points are presented to the bunch of ditto heads that support Trump, they will continue to deny that there is any problem with the planet and just continue with their rhetoric saying that climate change is just a liberal conspiracy. This new administration is looking to be another disaster and yet people keep flying their flags in support of a man who is too prideful to see the error in his ways.
Hello Ken, the blind, biased, and uninformed support for Trump will break down as the biosphere implosion rapidly accelerates. Lets all keep dishing up the truth, all will be forced to see it very soon. Denial will no longer be an option.