
Search Results for: disease
Well Known Scientist Sounds The Alarm On Geoengineering

Documentary Challenges Safety Of Geoengineering

Source: NorthJersey.com, article by Lianna Albrizio
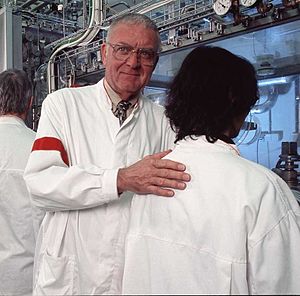
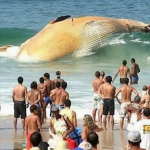
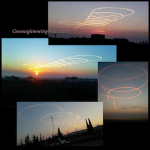
It was a day like no other in 2013 when George Barnes was outside his River Edge home. The award-winning director of photography was testing his time-lapse camera when he made a chance observation that changed his life.
While fortuitously playing the footage of the Volkswagen Beetle launch campaign backwards in high-speed, Barnes noticed that the lengthy white lines in the sky painted and erased were left behind by flying jets – research that led him to the conclusion that evidence exists of the practice of climate engineering. The practice, also called "geoengineering," is something Barnes defines as "the large-scale manipulation of the atmosphere," which is used by climate scientists to fight global warming.
"My heart stopped," he said of the images. "When I saw it, I knew something was terribly wrong with what I was looking at."
Climate engineering can be conducted through carbon dioxide removal and solar radiation management, which works to force the earth to absorb lesser amounts of solar radiation with the goal to mitigate the effects of greenhouse gases. Barnes, however, says there are concerns over the potential hazards the act could pose on humans. In an article published in "The Guardian" last year, environmental philosopher Stephen Gardiner points to questions of ethics concerning its practice.
5 Big Signs The Global Engine of Deceit, Lies, and Control Are Coming To End

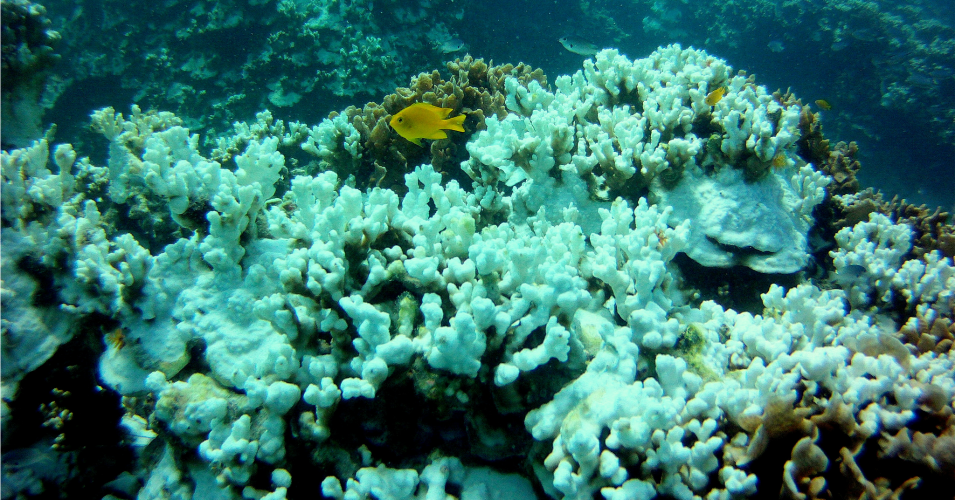
Warming Oceans Are Bleaching Coral Reefs, Putting Ecosystems at Risk
Source: Common Dreams
Increase in ocean temperatures 'may not seem like a lot but it makes a big difference to corals,' scientists say
Documents Show Navy’s Electromagnetic Warfare Training Would Harm Humans and Wildlife

Source: Truthout, article by Dahr Jamail
If the US Navy gets its way, it will begin flying Growler supersonic warplanes over Olympic National Forest and wilderness areas of the Western Olympic Peninsula next September in order to conduct electromagnetic warfare training exercises.
As Truthout previously reported, this would entail flying 36 jets down to 1,200 feet above ground in some areas, in 2,900 training exercises lasting up to 16 hours per day, 260 days per year, with the war-gaming going on indefinitely into the future. The Navy's plans also include having 15 mobile units on the ground with towers emitting electromagnetic radiation signals for the planes to locate as part of their exercises.
The Navy appeared to attempt to slide their plans by the public by choosing not to advertise public comment periods and meetings in the local media of the areas where their war games would be taking place. However, word got out and the Navy has had to extend public comment periods and hold more public meetings.
Navy personnel have been met with outrage, anger and a growing concern from the public about the negative health impacts to humans and wildlife in the areas where their war games are planned.
The Navy's response has been to point people toward their own so-called environmental assessment (EA), and claim that "no significant impacts" will occur to wildlife or humans from their electromagnetic war games.
Climate Engineering, Pushing Life Past The Point Of No Return

All available data from the ground paints a very dark horizon for life on planet Earth. Mathematically speaking, on the current trajectory we have no chance. The fact that this is so hard to accept for most people does not negate the reality itself. If one is driving straight toward a cliff at high speed it is easy enough to say that if they do not alter their course they will certainly perish. So what are our options? To radically change the course of civilization as we know it or we will all face the consequences of the collective actions (and inactions) of the human race. So many are in total denial. Even within the ranks of movements that claim to be fighting for the common good, denial is epidemic. How is it possible to believe that our species can perpetually expand and consume resources on a finite planet with finite resources? How can all this activity not have an effect on the equilibrium of the planet’s life support systems? The climate balance of the last 7 to 10 millennia (which was unique in the Earth’s history) has been disrupted from countless causes. Again, mathematically speaking, the single greatest cause appears to be the global climate engineering insanity (though, as already mentioned, there are countless other causes). With this in mind, the article below is an important read for those that truly want to understand just how dire our common dilemma is. When reading the article, and viewing the videos contained in it (also important to do) one must focus primarily on the data presented from the front lines. The fact that some of these scientists are calling for climate engineering to be implemented should not taint the data that reveals the unfolding reality on the ground. We MUST separate the baby from the bathwater. It is impossible to know what the underlying motives are for the scientists calling for climate engineering to be immediately deployed (as if it has not already been going on for over 6 decades). Perhaps they have been threatened, perhaps on this point they are also in denial. Climate engineering has made an already bad situation much worse overall and has poisoned all life in the process. Reviewing the data below is critical for those that want to understand more deeply just how dire and immediate our collective situation is. It is important to understand that climate engineering has helped to bring us to this dark corner. Geoengineering is not a cure but a curse that is even worse than the disease itself.
Dane Wigington
geoengineeringwatch.org
Extinction Rate Rivals That of Dinosaurs, 2014 Likely Hottest Year Ever
Source: Truthout
Recent studies show that current animal extinction rates from anthropogenic climate disruption now rival the extinction that annihilated the dinosaurs 65 million years ago. Once again, this month’s survey of the planet shows how climate disruption is continuing to intensify.
“The supreme reality of our time is … the vulnerability of our planet.”
– John F. Kennedy
Recent studies show that current animal extinction rates from anthropogenic climate disruption (ACD) now rival the extinction that annihilated the dinosaurs 65 million years ago.
What’s Really Going On With The Weather?

Source: Dorset Eye
Alerting The Public To A Climate In Crisis
The signs have been written in the sky in astonishing trails. The weather has been shouting it through drought and flood – and the documented evidence has been available on the internet for a very, very long time.
Global Extinction within one Human Lifetime as a Result of a Spreading Atmospheric Arctic Methane Heat wave and Surface Firestorm
Source: RobinWestenra @ Blogspot
Abstract
Although the sudden high rate Arctic methane increase at Svalbard in late 2010 data set applies to only a short time interval, similar sudden methane concentration peaks also occur at Barrow point and the effects of a major methane build-up has been observed using all the major scientific observation systems. Giant fountains/torches/plumes of methane entering the atmosphere up to 1 km across have been seen on the East Siberian Shelf. This methane eruption data is so consistent and aerially extensive that when combined with methane gas warming potentials, Permian extinction event temperatures and methane lifetime data it paints a frightening picture of the beginning of the now uncontrollable global warming induced destabilization of the subsea Arctic methane hydrates on the shelf and slope which started in late 2010. This process of methane release will accelerate exponentially, release huge quantities of methane into the atmosphere and lead to the demise of all life on earth before the middle of this century.
Introduction
The 1990 global atmospheric mean temperature is assumed to be 14.49 oC (Shakil, 2005; NASA, 2002; DATAWeb, 2012) which sets the 2 oC anomaly above which humanity will lose control of her ability to limit the effects of global warming on major climatic and environmental systems at 16.49 oC (IPCC, 2007). The major Permian extinction event temperature is 80 oF (26.66 oC) which is a temperature anomaly of 12.1766 oC above the 1990 global mean temperature of 14.49 oC (Wignall, 2009; Shakil, 2005).
Results of Investigation
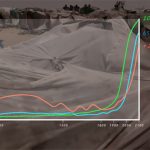
Figure 1 shows a huge sudden atmospheric spike like increase in the concentration of atmospheric methane at Svalbard north of Norway in the Arctic reaching 2040 ppb (2.04 ppm)(ESRL/GMO, 2010 – Arctic – Methane – Emergency – Group.org). The cause of this sudden anomalous increase in the concentration of atmospheric methane at Svalbard has been seen on the East Siberian Arctic Shelf where a recent Russian – U.S. expedition has found widespread, continuous powerful methane seepages into the atmosphere from the subsea methane hydrates with the methane plumes (fountains or torches) up to 1 km across producing an atmospheric methane concentration 100 times higher than normal (Connor, 2011). Such high methane concentrations could produce local temperature anomalies of more than 50 oC at a conservative methane warming potential of 25.
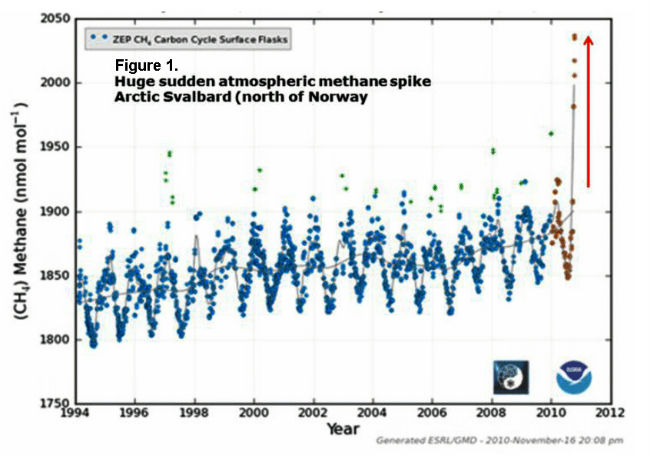
Figure 2 is derived from the Svalbard data in Figure 1 and the methane concentration data has been used to generate a Svalbard atmospheric temperature anomaly trend using a methane warming potential of 43.5 as an example. The huge sudden anomalous spike in atmospheric methane concentration in mid August, 2010 at Svalbard is clearly evident and the methane concentrations within this spike have been used to construct a series of radiating methane global warming temperature trends for the entire range of methane global warming potentials in Figure 3 from an assumed mean start temperature of -3.575 degrees Centigrade for Svalbard (see Figure 2) (Norwegian Polar Institute; 2011).
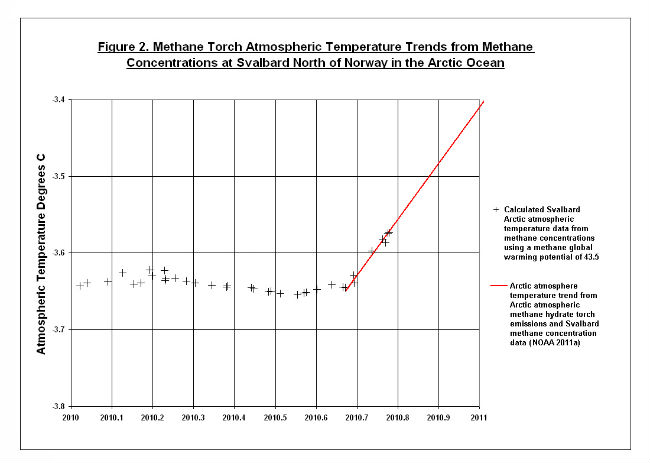
Figure 3 shows a set of radiating Arctic atmospheric methane global warming temperature trends calculated from the steep methane atmospheric concentration gradient at Svalbard in 2010 (ESRL/GMO, 2010 – Arctic-Methane-Emergency-Group.org). The range of extinction temperature anomalies above the assumed 1990 mean atmospheric temperature of 14.49 oC (Shakil, 2005) are also shown on this diagram as well as the 80 oF (26.66 oC) major Permian extinction event temperature (Wignall, 2009).
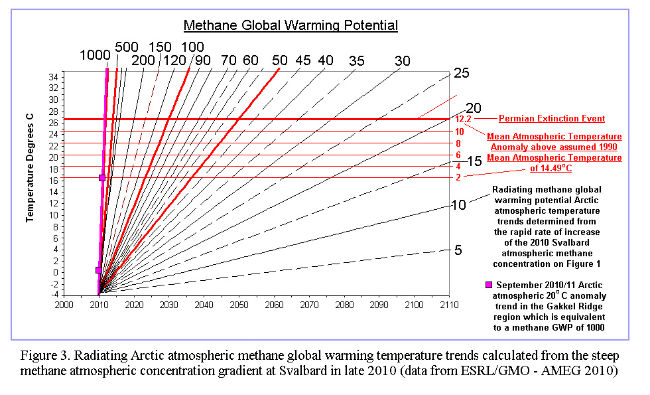
Sam Carana (pers. com. 7 Jan, 2012) has described large December 2011 (ESRL-NOAA data) warming anomalies which exceed 10 to 20 degrees centigrade and cover vast areas of the Arctic at times. In the centres of these regions, which appear to overlap the Gakkel Ridge and its bounding basins, the temperature anomalies may exceed 20 degrees centigrade. The temperature anomalies in this region of the Arctic for the period from September 8 2011 to October 7, 2011 were only about 4 degrees Centigrade above normal (Carana, pers. com. 2012). This data set can be seen on this site:- http://arctic-news.blogspot.com/p/arctic-temperatures.html
Because the Svalbard methane concentration data suggests that the major spike in methane emissions began in late 2010 it has been assumed for calculation purposes that the 2010 temperature anomalies peaked at 4 degrees Centigrade and the 2011 anomalies at 20 degrees Centigrade in the Gakkel Ridge region. The assumed 20 degree Centigrade temperature anomaly trend from 2010 to 2011 in the Gakkel Ridge region requires a methane gas warming potential of about 1000 to generate it from the Svalbard methane atmospheric concentration spike data in 2010. Such high methane warming potentials could only be active over a very short time interval (less than 5.7 months) as shown when the long methane global warming potential lifetimes data from the IPCC (2007; 1992) and Dessus, Laponte and Treut (2008 ) are used to generate a global warming potential growth curve with a methane global warming potential of 100 with a lifespan of 5 years.
Because of the high methane global warming potential (1000) of the 2011, 20 oC temperature anomalies in the Gakkel Ridge region, the entire methane global warming potential range from 5 to 1000 has been used to construct the radiating set of temperature trends shown in Figure 3. The 50, 100, 500 and 1000 methane global warming potential (GWP) trends are red and in bold. The choice of a high temperature methane peak with a global warming potential near 1000 is in fact very conservative because the 16 oC increase is assumed to occur over a year. The observed ESRL-NOAA Arctic temperature anomalies varied from 4 to 20 degrees over less than a month in 2011 (Sam Carana, pers. comm. 2012).
Figure 4 shows the estimated lifetime of a globally spreading Arctic methane atmospheric veil for different methane global warming potentials with the minimum, mean and maximum lifetimes fixed with data from Dessus, Laponche and Treut (2008) and IPCC (2007, 1992). On this diagram it is evident that the maximum methane global warming potential temperature trend of 50 intersects the 2 degree centigrade temperature anomaly line in mid 2027 at which time humanity will completely lose our ability to combat the earth atmospheric temperature rise. This diagram also indicates that methane will be an extremely active global warming agent for the first 15 years during the early stages of the extinction process. At the 80 o F (26.66 oC) Permian extinction event temperature line (Wignall, 2009), which has a 12.177 oC temperature anomaly above the 1980 mean of 14.49 oC, the lifetime of the minimum methane global warming potential veil is now some 75 years long and the temperature so high that total extinction of all life on earth will have occured by this time.
The life time from the almost instantaneous injection of methane into the atmosphere in 2010 is also shown as the two vertical violet lines (12 +- 3) years and this has been extended by 6 percent to 15.9 years to take account of increased methane concentrations in the future (IPCC, 1992b). This data set can be used to set up the likely start position for the extinction event from the large methane emissions in 2010.
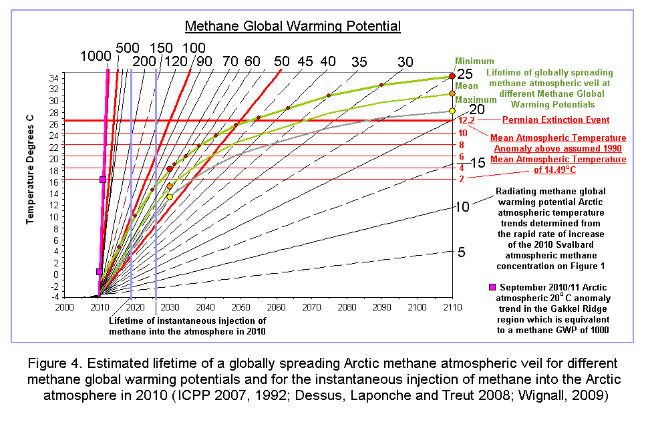
Figure 5 shows the estimated Arctic Gakkel Ridge earthquake frequency temperature increase curve (Light, 2011), the Giss Arctic mean November surface temperature increase curve (data from Carana, 2011) and the mean global temperature increase curve from IPCC (2007) long term gradient data. The corrected Arctic atmospheric temperature curve for the ice cap melt back in 2015 was derived from the mean time difference between the IPCC model ice cap and observed Arctic Ice cap rate of volume decrease (Masters, 2009). The ice cap temperature increase curve lags behind the Arctic atmosphere temperature curve because of the extra energy required for the latent heat of melting of the permafrost and Greenland ice caps (Lide and Frederickse, 1995).
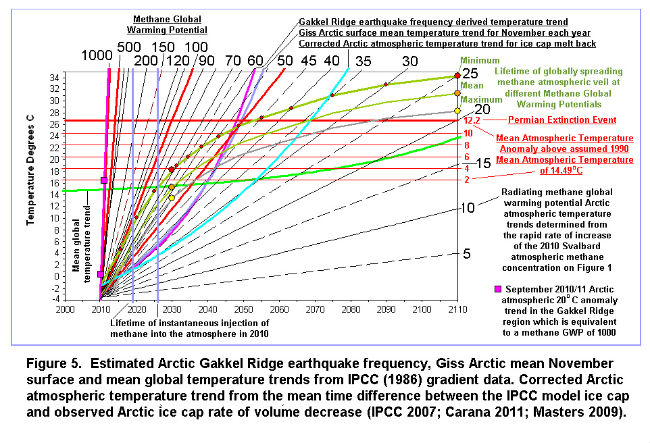
Figure 6 shows 5 mathematically and visually determined best estimates of the possible global atmospheric extinction gradients for the minimum (a), mean (b) and maximum (e) methane global warming potential lifetime trends. The mean (c) methane global warming potential lifetime trend has almost the identical gradient to the best mathematical fit over the temperature extinction interval (2 oC to 12.2 oC temperature anomaly zone) as the Arctic Gakkel Ridge frequency data (b) and the Giss Arctic mean November surface temperature data (d). This suggests that the Giss Arctic mean November surface temperature curve and the Arctic Gakkel Ridge frequency temperature curves are good estimates of the global extinction temperature gradient.
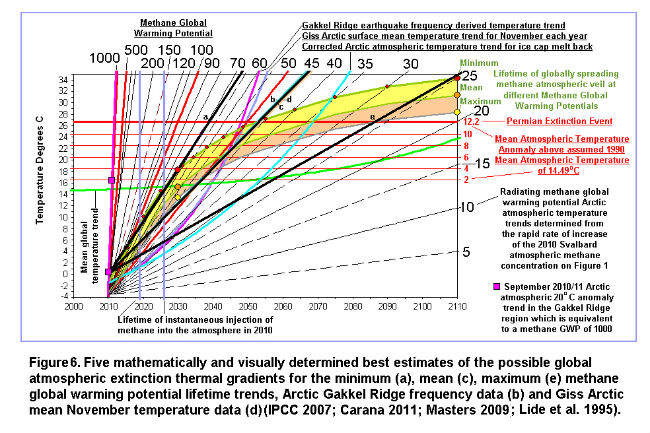
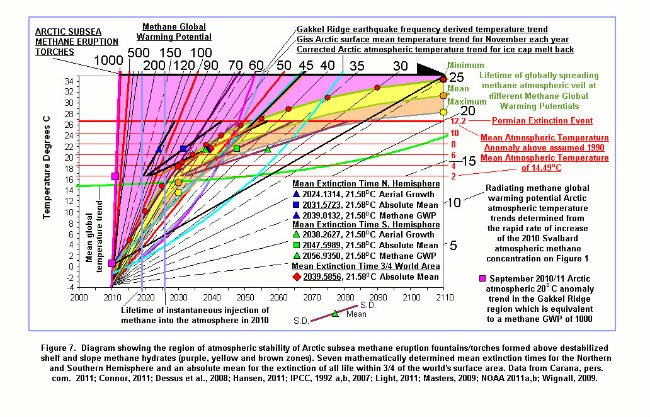
Figure 7 diagramatically shows the funnel shaped region in purple, yellow and brown of atmospheric stability of methane derived from Arctic subsea methane eruption fountains/torches formed above destabilized shelf and slope methane hydrates (Connor, 2011). The width of this zone expands exponentially from 2010 with increasing temperature to reach a lifetime of more than 75 years at 80 o F (26.66 oC) which is the estimated mean atmospheric temperature of the major Permian extinction event (Wignall 2009). The previous most catastrophic mass extinction event occured in the Permian when atmospheric methane released from methane hydrates was the primary driver of the massive mean atmospheric temperature increase to 80 oF (26.66 oC) at a time when the atmospheric carbon dioxide was less than at present (Wignall, 2009).
Method of Analysis
By combining fractional amounts of an assumed standard Arctic methane fountain/torch/plume with a global warming potential of 1000 (which equals a 16 oC temperature rise (4 – 20 oC) over one year – 2010 – 2011) with the mean global temperature curve (from IPCC 2007 – gradient data) it was possible to closely match the 5 visually and mathematically determined best estimates of the global extinction gradients shown in Figure 6 (a to e). Because the thermal radiant flux from the earth into space is a function of its area (Lide and Fredrickse, 1995) we can roughly determine how many years it will take for the methane to spread globally by getting the ratio of the determined fraction of the mean global temperature curve to the fraction of the Arctic methane fountain/torch/plume curve, as the latter is assumed to represent only one year of methane emissions. In addition as the earth’s surface area is some 5.1*10^8 square kilometres (Lide and Fredrickse, 1995) a rough estimate of the average area of the region over which the methane emissions occur within the Arctic can also be determined by multiplying the Arctic methane/torch/plume fraction by the surface area of the earth. The Arctic fountain/torch areas are expressed as the diameter of circular region of methane emissions or the two axes A and B of an ellipse shaped area of methane emissions (where B = 4A) (Table 1)
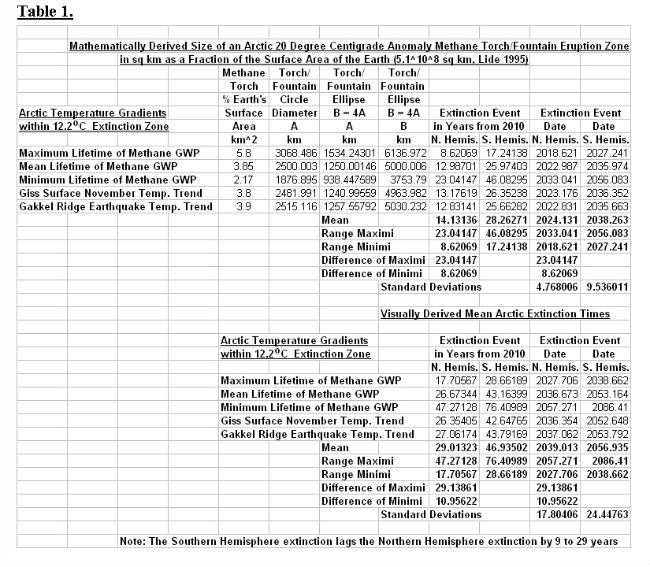
Twenty estimates have been made of the times of the various extinction events in the northern and southern hemispheres and these are shown on Table 1 and summarised on Figure 7 with their ranges. The absolute mean extinction time for the northern hemisphere is 2031.8 and for the southern hemisphere 2047.6 with a final mean extinction time for 3/4 of the earth’s surface of 2039.6 which is similar to the extinction time suggested previously from correlations between planetary orbital mechanics and the frequency increase of Great and Normal earthquake activity on Earth (Light, 2011). Extinction in the southern hemisphere lags the northern hemisphere by 9 to 29 years.
Figure 8 shows a different method of interpreting the extinction fields defined by the (12 +-3) + 6% year long lifetime of methane (IPCC, 1992) assumed to have been instantaneously injected into the Arctic atmosphere in 2010 and the lifetime of the globally spreading methane atmospheric veil at different methane global warming potentials. The start of extinction begins between 2020 and 2026.9 and extinction will be complete in the northern hemisphere by 2057. Extinction will begin around 2024 in the southern hemisphere and will be completed by 2087. Extinction in the southern hemisphere, in particular in Antarctica will be delayed by some 30 years. This makes property on the Transantarctic mountains of premium value for those people wish to survive the coming methane firestorm for a few decades longer..
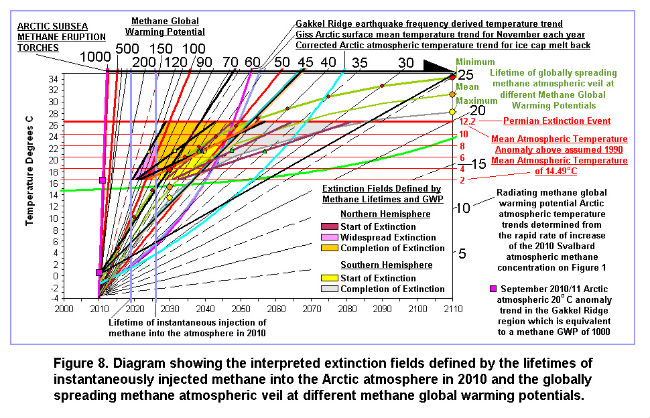
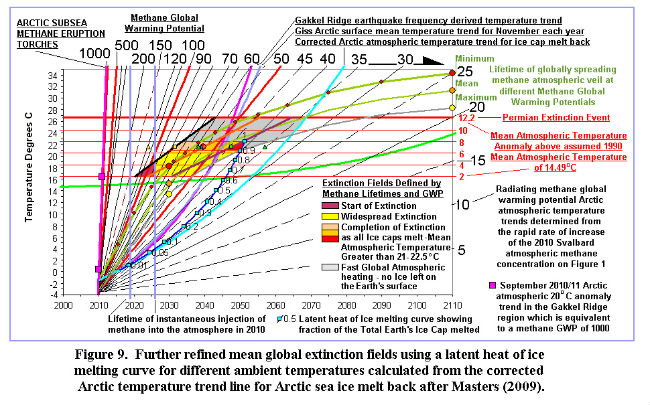
Figure 9. is a further refinement of the extinction fields shown in Figure 8. by defining a new latent heat of ice melting curve at different ambient temperatures which has been calculated from the corrected Arctic atmospheric temperature trend for the ice cap melt back defined by the difference between the Piomass observed melt back time and the IPCC modelled melt back time which predicts the melt back incorrectly some 50 years into the future (Masters, 2009). This work shows that the IPCC climate models are probably more than 100 years out in their prediction of the complete melting of the Greenland and Antarctic ice caps.
Method of Analysis
To melt 1 kg of ice you require 334 kilo Joules of energy (the latent heat of melting of ice) to transform the solid into the liquid at 0 oC (Wikipedia, 2012 ).
Subsequently for each one oC temperature rise, the water requires and additional 4.18 kilo Joules to heat it up to the ambient temperature (Wikipedia, 2012). An 80 oC temperature rise of a 1 kg mass of water requires almost exactly the same amount of energy input (334.4 kJ) as the amount of energy required by the latent heat of melting of ice (334 kJ) to covert one kg of ice into water at 0 oC. Because one Joule is the energy equivalent of the power of one watt sustained for one second there is also a time element in the melting of the ice and the heating up of the water, i.e. it is the function of temperature increase and the time similar to the way oil is generated in sediments (Lopatin, 1971; Allen and Allen, 1990).
If we consider the time necessary to melt one kg of ice and then raise its temperature to 80 oC, both of the above processes require the same amount of energy so we can consider that the first half of the time will simply involve conversion the solid ice into a liquid state at 0 oC and the second half of the time in heating the resulting ice water from 0 to 80 oC. This means that the ice melt curve at 80 oC will lag the atmospheric temperature line by half the time at 80 oC.
For temperatures less than 80 oC, the energy necessary to raise the water formed from the melted ice to the ambient temperature is less than that required for the latent melting of the ice (required to move it from a solid to a liquid state) and progressively more relative energy is needed at low temperatures to melt the ice.
The following formulation has been used to calculate the ratio of the time necessary for the melting of 1 kg of ice to water a 0 oC to the time necessary for the heating up of the 1 kg of water produced from the melted ice to the specified ambient temperature.
For any power n, let 2^n represent the ambient temperature of 1 kg of water which was derived from the melting of 1 kg of ice.
The energy required for the original melting of the 1 kg ice to water at 0 oC (latent heat of melting of ice) = 2^(n-3)/10 = 2^n/(2^3*10) = 2^n/80 = ambient temperature/80
Examples;
Let n=1; therefore temperature = 2^1 = 2 oC
Latent heat of melting = 2^(n-3)/10 = 2^-2/10 = 1/10*1/(2^2) =1/10*1/4 = 1/40
Let n=5; therefore temperature = 2^5 = 32 oC
Latent heat of melting = 2^(n-3)/10 = 2^2/10 = 4/10
The ratio of the time required for the latent heat of melting at any temperature is the reciprocal of the above = 10/(2^n-3)
The total time is therefore
a.) The time necessary for the latent heat of melting to covert 1 kg of ice into water
at 0 oC = 10/(2^n-3)
and:-
b.) The time required to heat up the 1 kg of water up to a temperature of 2^n = 1.
The total time = (10/(2^n-3)+1)
Therefore the fraction of time needed to simply melt the ice to 0 oC before it is raised to the ambient temperature 2^n = 10/(2^n-3)/((10/(2^n-3))+1)
Now: ((10/(2^n-3)) +1) = (10+ (2^n-3))/(2^(n-3))
The total time is therefore = 10/(10+(2^n-3))
Examples showing the calculation of the time ratio of the energy of latent heat of melting of ice to form water at 0 oC to the energy necessary to raise the water to the ambient temperature are shown below:-
N 2^n oC Fraction Formula Fraction
0 1 10/(10+1/8) 0.9877
1 2 10/(10+1/4) 0.9756
2 4 10/(10+1/2) 0.9526
3 8 10/(10+1) 0.9091
4 16 10/(10+2) 0.8333
5 32 10/(10+4) 0.7143
6 64 10/(10+8) 0.5555
6.32193 80 10/(10+10) 0.5000
The time value at each temperature of the corrected Arctic atmospheric temperature trend from the observed ice cap melt back (Masters, 2009) has been multiplied by the above fraction for each ambient temperature to determine a new “latent heat of ice melting curve” which represents the temperature – time energy necessary for the complete melting of the ice to water at 0 oC without the additional energy needed to raise the water to the ambient temperature of the atmosphere. This latent heat of ice melting curve is shown as the dark blue line on Figure 9.
The maximum mean global atmospheric temperature above which all the world’s icecaps will have completely melted away is estimated to lie between 7 oC and 8 oC above the mean global temperature which here is taken as 14.49 oC in 1990 (IPCC, 2007). The critical temperatures above which the Earth will entirely lose its ice caps are between 21.49 oC and 22.49 oC. It has been found however that the latent heat of ice melting curve first intersects the maximum lifetime stability line for atmospheric methane calculated from the methane global warming potentials (see. Figure 3) at the 20.964 oC extinction line (6.474 degrees centigrade above the atmospheric mean temperature of 14.49 oC in 1980) at 2050.1 and the 22.49 oCextinction line (8 oC above the atmospheric mean temperature of 14.49 oC in 1980) at 2051.3. Therefore the limits of the final melting and loss of all ice on Earth have been fixed between the 6.474 oC and 8 oC anomalies above the 1990 mean atmospheric temperature of 14.49 oC. This very narrow temperature range includes all the mathematically and visually determined extinction times and their means for the northern and southern hemispheres which were calculated quite separately (Figure 7; Table 1).
Once the world’s ice caps have completely melted away at temperatures above 22.49 oC and times later than 2051.3, the Earth’s atmosphere will heat up at an extremely fast rate to reach the Permian extinction event temperature of 80oF (26.66 oC)(Wignall, 2009) by which time all life on Earth will have been completely extinguished.
The position where the latent heat of ice melting curve intersects the 8 oC extinction line (22.49 oC) at 2051.3 represents the time when 100 percent of all the ice on the surface of the Earth will have melted. If we make this point on the latent heat of ice melting curve equal to 1 we can determine the time of melting of any fraction of the Earth’s icecaps by using the time*temperature function at each time from 2051.3 back to 2015, the time the average Arctic atmospheric temperature curve is predicted to exceed 0 oC. The process of melting 1 kg of ice and heating the produced water up to a certain temperature is a function of the sum of the latent heat of melting of ice is 334 kilo Joules/kg and the final water temperature times the 4.18 kilo Joules/Kg.K (Wikipedia, 2012). This however represents the energy required over a period of one second to melt 1 kg of ice to water and raise it to the ambient temperature. Therefore the total energy per mass of ice over a certain time period is equal to (334 +(4.18*Ambient Temperature)*time in seconds that the melted water took to reach the ambient temperature. From the fractional time*temperature values at each ambient temperature the fractional amounts of melting of the total global icecaps have been calculated and are shown on Figure 9.
The earliest calculated fractional volume of melting of the global ice caps in 2016 is 1.85*10^-3 of the total volume of global ice with an average yearly rate of ice melting of 2.557*10^-3 of the total volume of global ice. This value is remarkably similar to, but slightly less than the average rate of melting of the Arctic sea ice measured over an 18 year period of 2.7*10^-3 (1978 to 1995; 2.7% per decade – IPCC 2007).This close correlation between observed rates of Arctic ice cap and predicted rates of global ice cap melting indicates that average rates of Arctic ice cap melting between 1979 and 2015 (which represents the projected time the Arctic will lose its ice cover – Masters, 2009) will be continued during the first few years of melting of the global ice caps after the Arctic ice cover has gone in 2015 as the mean Arctic atmospheric temperature starts to climb above 0 oC. However from 2017 the rate of melting of the global ice will start to accelerate as will the atmospheric temperature until by 2049 it will be more than 9 times as fast as it was around 2015 (Table 2).
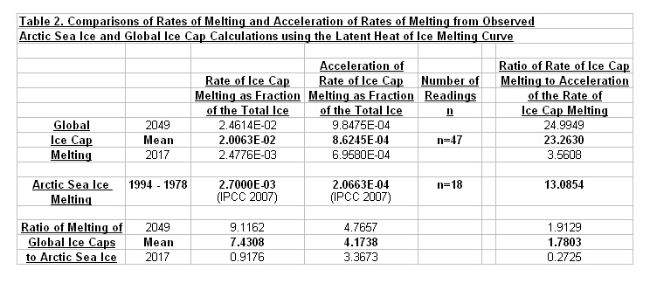
The mean rate of melting of the global icecap between 2017 and 2049 is some 2*10^-2, some 7.4 times the mean rate of melting of the Arctic ice cap (Table 2). In concert with the increase in rate of global ice cap melting between 2017 and 2049, the acceleration in the rate of melting also increases from 7*10^-4 to 9.9*10^-4 with a mean value close to 8.6*10^-4 (Table 2). The ratio of the acceleration in the rate of global ice cap melting to the Arctic ice cap melting increases from 3.4 in 2017 to 4.8 by 2049 with a mean near 4.2. This fast acceleration in the rate of global ice cap melting after 2015 compared to the Arctic sea ice cap melting before 2015 is because the mean Arctic atmospheric temperature after 2017 is spiraling upward in temperature above 0 oC adding large amounts of additional energy to the ice and causing it to melt back more quickly.
The melt back of the Arctic ice cap is a symptom of the Earth’s disease but not its cause and it is the cause that has to be dealt with if we hope to bring about a cure. Therefore a massive cut back in carbon dioxide emissions should be mandatory for all developed nations (and some developing nations as well). Total destruction of the methane in the Arctic atmosphere is also mandatory if we are to survive the effects of its now catastrophic rate of build up in the atmospheric methane concentration However cooling of the Arctic using geoengineering methods is also vitally important to reduce the effects of the ice cap melting further enhancing the already out of control destabilization of the methane hydrates on the Arctic shelf and slope.
· Developed (and some developing) countries must cut back their carbon dioxide emissions by a very large percentage (50% to 90%) by 2020 to immediately precipitate a cooling of the Earth and its crust. If this is not done the earthquake frequency and methane emissions in the Arctic will continue to grow exponentially leading to our inexorable demise between 2031 to 2051.
· Geoenginering must be used immediately as a cooling method in the Arctic to counteract the effects of the methane buildup in the short term. However these methods will lead to further pollution of the atmosphere in the long term and will not solve the earthquake induced Arctic methane buildup which is going to lead to our annihilation.
· The United States and Russia must immediately develop a net of powerful radio beat frequency transmission stations around the Arctic using the critical 13.56 MHZ beat frequency to break down the methane in the stratosphere and troposphere to nanodiamonds and hydrogen (Light 2011a) . Besides the elimination of the high global warming potential methane, the nanodiamonds may form seeds for light reflecting noctilucent clouds in the stratosphere and a light coloured energy reflecting layer when brought down to the Earth by snow and rain (Light 2011a). HAARP transmission systems are able to electronically vibrate the strong ionospheric electric current that feeds down into the polar areas and are thus the least evasive method of directly eliminating the buildup of methane in those critical regions (Light 2011a).
The warning about extinction is stark. It is remarkable that global scientists had not anticipated a giant buildup of methane in the atmosphere when it had been so clearly predicted 10 to 20 years ago and has been shown to be critically linked to extinction events in the geological record (Kennett et al. 2003). Furthermore all the experiments should have already been done to determine which geoengineering methods were the most effective in oxidising/destroying the methane in the atmosphere in case it should ever build up to a concentration where it posed a threat to humanity. Those methods need to be applied immediately if there is any faint hope of reducing the catastrophic heating effects of the fast building atmospheric methane concentration.
Malcolm Light 9th February, 2012
References
Arctic Methane Emergency Group
ameg.me
Allen, P.A., and Allen, J.R. Basin Analysis, Principles and Applications. Blackwell, Oxford, 451 pp.
Carana, S. 2011b. Light, M.P.R. and Carana, S. 2011c. – Methane linked to seismic activity in the Arctic.
http://arctic-news.blogspot.com/p/seismic-activity.html
Carana, S. 2011g. Runaway Global Warming.
http://geo-engineering.blogspot.com/2011/04/runaway-global-warming.html
Connor, S. 2011. Shock as retreat of Arctic sea ice releases deadly greenhouse gas. Russian research team astonished after finding fountains of methane bubbling to surface. The Independent.
http://www.independent.co.uk/environment/climate-change/shock-as-retreat-of arctic-sea-ice-releases-deadly-greenhouse-gas-6276134.html
DATAWeb, 2011. Combined Data Earth Policy Institute.
www.earth-policy.org/datacenter/…/update29_5x
Dessus, B., and Laponche B., Herve le Treut, 2008. Global Warming: The Significance of Methane bd-bl-hlt January 2008.
http://www.global-chance.org/IMG/pdf/CH4march2008.pdf
Hansen, J. E. 2011. GISS Surface Temperature Analysis. NASA. Goddard Institute for Space Physics. http://data.giss.nasa.gov/cgibin/gistemp/do_nmap.py?year_last=2011&month_last=08&sat=4&sst=1&type=anoms&mean_gen=02&year1=2009&year2=2009&base1=1951&base2=1980&radius=1200&pol=pol
Intergovernmental Panel on Climate Change (IPCC) 1992a. Climate Change. The IPCC Scientific Assessment (Edited by J. J. Houghton, G. J. Jenkins and J. J. Ephraums). Cambridge University Press, Cambridge. U.K.
Intergovernmental Panel on Climate Change (IPCC) 1992b. Climate Change in 1992. The Supplementary report to the IPCC Scientific Assessment (Edited by J. J. Houghton, B. A. Callander and S. K. Varney). Cambridge University Press, Cambridge. U.K.
Intergovernmental Panel on Climate Change (IPCC) 2007a. Fourth Assessment Report on Climate Change 2007. FAO 3.1, Figure 1, WG1, Chapter 3, p. 253.
http://blogs.ei.colombia.edu/wp-content/uploads/2010/12/graph-2-600X422.jpg
Intergovernmental Panel on Climate Change (IPCC) 2007b. Synthesis Report
http://www.ipcc.ch/publications_and_data/ar4/syr/en/spms1.html
Kennet, J.P., Cannariato, K.G., Hendy, I.L., Behl, R.J., 2003. Methane Hydrates in Quaternary Climate Change. The Clathrate Gun Hypothesis, Washington D.C., American Geophysical Union. ISBN 0875902960
Lide. D.R. and Frederikse H.P.R., 1995. CRC Handbook of Chemistry and Physics. 75th Edition, CRC Press, London. pp. 1-1 – 1-33.
Light M.P.R. 2011a. Use of beamed interfering radio frequency transmissions to decompose Arctic atmospheric methane clouds. Edited by Sam Carana.
http://arctic-news.blogspot.com/p/decomposing-atmospheric-methane.html
Lopatin, N.V. 1971. Temperature and geologic time as factors in coalification (in Russian). Akad. Nauk SSSR. Izvestiya. Seriya Geologicheskaya, 3, pp.95 – 106.
Masters. J. 2009. Top Climate Story of 2008. Arctic Sea Ice Loss. Dr Jeff Masters Wunderblog.
http://www.wunderground.com/blog/JeffMasters/comment.html?entrynum=1177
NASA, 2002. Global Temperature Anomalies in 0.1C. Goddard Institute for Space Studies., NASA Goddard Space Flight Center, Earth Sciences Directorate.
http://www.giss.nasa.gov/data, updated December 2002.
Norwegian Polar Institute, 2001. Svalbard, Climate:
http://www.npolar.no/en/the-arctic/svalbard/
NOAA 2011a. Huge sudden atmospheric methane spike Arctic Svalbard (north of – Norway)
http://arctic-news.blogspot.com/p/need-for-geo-engineering.html
NOAA 2011b. Huge sudden methane spike recorded at Barrow (BRW), Alaska, United States. Generated ESRL/GMO – 2011. December 14-17-21 pm
http://arctic-news.blogspot.com/p/need-for-geo-engineering.html
Rianovosti, 2011. Russian, US scientists set to study methane release in Arctic. ScienceRSS
http://en.rian.ru/science/20110902/166364635.html
Semiletov, I. 2011. Quoted from Itar-Tass. Heavy methane emissions found in the Arctic Eastern Sector. Itar-Tass. September 26, 2011.
http://www.itar-tass.com/en/c154/233799.html
Shakel M., 2005. Sustainability: Our Environment.
http://www.earthethicsinstitute.org/facultycurriculum-pdf/sustainability%20exploration20in%Mathematics.pdf
Shakova N., Semiletov, I., Salyuk, A., and Kosmach, D., 2008. Anomalies of methane in the atmosphere over the East Siberian Shelf. Is there any sign of methane leakage from shallow shelf hydrates? EGU General Assembly 2008. Geophysical Research Abstracts, 10, EGU2008-A-01526
http://meetings.copernicus.org/www.cosis.net/abstracts/EGU2008/01526/EGU2008-A-01526.pdf
Shakova, N. and Semiletov, I., 2010a. Methane release from the East Siberian Shelf and the potential for abrupt climate change. Presentation in November 30, 2010.
http://symposium2010.serdp-estcp.org/Technical-Sessions/1A
Shakova N., Semiletov, I., Leifer, I., Salyuk, A., Rekant, P., and Kosmach, D. 2010b. Geochemical and geophysical evidence of methane release over the East Siberian Arctic Shelf. Journal Geophys. Research 115, C08007
http://europa.agu.org/?view=article&uri=/journals/jc/jc1008/2009jcoo5602/2009jc005602.xml
Shakova, N., Semiletov, I., Salyuk, A., Yusupov, V., Kosmach, D., and Gustafsson, O., 2010c. Extensive methane venting to the atmosphere from sediments of the East Siberian Arctic Shelf. Science.
http://www.sciencemag.org/content/327/5970/1246.short
Wignall, P. 2009. Miracle Planet; Episode 4, Part 2. Coproduced by NHK (Japan) and the National Film Board of Canada (NFB).
http://www.youtube.com/watch?v=exfNNDExxic&list=PL0200B1S24E220C5A&feature=playerembedded#
Wikipedia., 2012. Enthalpy of Fusion.
http://en.wikipedia.org/wiki/Enthalpy_of_fusion
The following is a diagram by Sam Carana illustrating the progress

Source: RobinWestenra @ Blogspot
Staying Healthy In A World That Isn’t

It’s not easy to retain one’s health in a world that is being constantly bombarded with contamination from too many directions to comprehend. Many people have many different ideas about how to stay healthy, but are such suggested methods down to earth, straight forward and doable protocols? I am familiar with the author of the article below, TC Randal, and believe he is giving some very on target advice. I have followed a similar line of health defense my entire adult life and it has been of immense benefit to me. First and foremost we must strive to expose and eliminate the biggest and most lethal source of global contamination, climate engineering. But as we march forward in this fight, it is essential for us to retain as much of our state of health as possible. Doing so will make us much more effective in the battle to stop climate engineering.
Dane Wigington
geoengineeringwatch.org
Cleanse, Flush, Sweat, Mobilize, Chelate, Detox…and Heal
Source: Green Med Info

It’s an industrial world out there. Few pristine places are left on Earth, and even there the winds of industry blow. Luckily we have answers.
Obviously sunshine, exercise, a truly healthy diet and a happy mindful kinetic lifestyle are lobby-level, yet illness can begin in the best of us when toxic chemical intake and auto-generated wastes overwhelm the capacity for elimination. In other words the rate of elimination must meet or exceed input…or toxins accumulate. Amalgam fillings, air and water pollution, smoking, eating fish and processed foods, pesticides, battlefield toxins, radiations and drug residues commonly lead to cancers, heart/artery disease, autism, depression, PTSD, candidiasis, viral infections, autoimmune disorders, etc., etc. These conditions can logically and practically be prevented, improved or reversed by expeditious elimination of the offending molecules.
The term “cleanse” usually causes us to think “bowel” cleanse with strong laxatives and dreadful colonics traditionally used to address gross elimination problems. The intestinal tract can become a plumber’s nightmare so consider that vitamin C doses exceeding bowel tolerance leave one clean as a whistle in a few hours.
Attention then zooms in on the intestinal floral population, care and feeding of the good guys and starvation of pathogens. This is done by eliminating sugars and processed carbs (gluten/GM grains) and killing yeasts and other bad guys directly with oregano oil or oxygen releasing products.
And then focus on healing the cells lining the intestines that otherwise leak toxins, pathogens, emulsified fats and proteins directly into the bloodstream to source allergies and autoimmune disorders. Cells respond to saturated fats like butter/coconut oil and Omega 3 fats, high fiber leafy greens and green juices w spirulina, intermittent fasting, bone/cartilage soups, raw milks/yogurts, minerals like K, Mn, Se, Zn and Mg, Vitamins C/E and other phyto-antioxidants like curcuminoids, carotenoids, cannabinoids….and regenerate.
“Flush” commonly refers to liver and kidney cleansing. They are targeted with various herbal/olive oil flushes. R-Alpha Lipoic Acid, silymarin, beets, liver and added baking soda for kidneys help restore function. The GMI database holds a laundry list of regenerative aids for these organs.
“Sweating” and sauna raise body temperature, dump wastes and stimulate all biochemical activity, circulation of blood and lymph.
Hot baths of epsom salts or dead sea salts and soaking in ocean water draw-out toxins while infusing alkalizing magnesium; all transdermally.
Sunbathing raises body temperature when photons, at various wavelengths from infra red to ultra violet, penetrate the skin to not only produce Vitamin D, but entrain body frequencies and energize our predominant water fraction. UV and radiant heat make H2O’s charge, polarity and conductivity stronger so blood, lymph and other body fluids become thinner. This speeds circulation moving oxygen-rich blood in, waste products out.
Exercise, massage and quick temperature shifts like a sauna followed by plunging into cold water agitate fluids that had become stagnant during periods of inactivity. Hot peppers are also great for enhancing circulation.
Still, in spite of cleanses, flushes and sauna, metals and toxins will remain lodged in body fat, bones, nerve tissues and cell membranes. A double barreled defense is required. First mobilize them…. then chelate them.
Chelation does not occur efficiently without MOBILIZATION…
Cellular detoxification is initiated when a flood of electrons (using mega-Vitamin C/baking soda) moves materials out of tissues and organs into the bloodstream and on to the kidneys or the intestines to be snatched by chelators. This electron-driven liberation of metals is punctuated by electron-stealing bursts of oxidation ( mega-Vit C generated peroxides, hydrogen peroxide, MMS chlorite, ozone) that disassemble organic poisons, pathogens, fibrin overgrowth and cell debris. Oxidative bursts also spark redox signalling to provoke the release of more in-house antioxidants like SOD and glutathione and awaken other dormant genes to produce protective enzymes.
“Chelate” really just means “to grab or claw-on to” (toxins).
Chelation Therapy generally refers to IV infusions of EDTA, DMSA, DMPS, etc. that rapidly mobilize and attach toxins….and unfortunately vital minerals which must be concurrently resupplied.
The practice has been maligned by conventional medicine in apparent ignorance of the disruption minute quantities of toxins wield upon normal physiology at the molecular level, namely acidity, free radical predation, oxidative stress and inflammation.
Chelation therapy has been used to treat heavy metal poisoning, but is not recognized by the FDA for the treatment of disease. The FDA also refuses to admit the connection between mercury, cadmium, aluminum, etc. and a raft of conditions carelessly caused by our politically protected industries. Fortunately everything you need for personal detoxification is freely available.
Chelation can be accomplished without IVs by employing many common substances such as chlorella, clays, charcoal, shilajit/humates, cilantro and zeolites which bind to toxins along with sulfur compounds in R-Alpha Lipoic Acid, garlic, onions, MSM and NAC.
Proteolytic enzymes like papain, bromelain or nattokinase can help free metals sequestered beneath fibrin films.
The word “DETOX” has long been associated with “drying-out” alcoholics, rehab and addictions. Today it’s all about improving inner charge terrain so that cells can get more oxygen, regain functionality and self heal. A wide variety of supplements, physical and psychological treatments come under the detoxification umbrella, and indeed seemingly disconnected approaches all lead to the same goal.
Toxins are foreign molecules (like Al, F, Hg, Pb, etc. and a host of organic poisons), damaged molecules (oxidized/trans fats, protein/fat fragments), metabolic waste products, excessive acids and free-radicals of exogenous (radiations) and endogenous (immune response/inflammation) origins. These molecules must ultimately be transformed and eliminated at the atomic level….or the organism will suffer oxidative stress (inflammation), the root of most every disease.
Hair analysis is invaluable in 1) identifying metal/mineral presence and 2) to monitor the effectiveness of your efforts to evict heavy metals and normalize Mg, Ca, Na and K levels. Many times blood work does not detect the extent of contamination.
Interestingly, younger individuals commonly hold significant metal burdens since this generation has known only higher levels of toxins over the last 20yrs compared to their predecessors.
Once follow-up hair tests report healthy levels in all categories and symptoms magically disappear, you will have certain proof….whether the FDA likes it or not.
These alternative practices and “home remedies” require a bit of skill in use and an understanding of their actions. Things like chicken soup, apple cider vinegar, cayenne, garlic, epsom salts or Vit C/baking soda have specific healing properties when used in appropriate, usually unusually large quantities, taken regularly and in concert. Include as many as needed while focusing on mineral supplementation and the key elements of mobilization and chelation. I prefer detoxing at home over humiliating rectal intrusion or rapid IV chelation, slowly, gently and inexpensively for extended periods. Just me.
Detoxification is a survival strategy and should become a way of life. We have 365 chances a year to get it right, to do something, to take action, to clean our inner environments, to maintain our quality of life and to allow cells to self-heal.
 Capt. Randall is the author of Forbidden Healing, an organic farmer and independent health researcher. He studied chemistry and biology at the University of Florida. His interests range from marine science to archaeology and ethnobotany. See forbiddenhealingforum.com
Source: Green Med Info
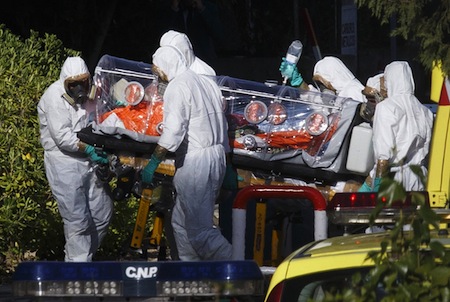
The Ebola Card, Commentary From A Former Government Official

Dr. Paul Craig Roberts is a former Reagan administration cabinet official who has been an outspoken voice of truth and reason for decades. Dr. Roberts is highly respected and regarded internationally as a source of accurate perspectives and information. So what is Roberts saying about the whole Ebola situation? The article below makes some very important observations that should be considered. Whatever the global powers are up to in regard to the Ebola outbreak, all indications are that our government and others are highly involved with the manipulation of this situation. More and more information is piling up to indicate that the Ebola virus was likely engineered. The power structure is being pushed further into a corner with each passing day, this makes them more dangerous than ever. Even if steps were taken on the ground to curb the spread of the deadly Ebola pathogen, the aerosol spraying programs (geoengineering, SRM, SAG, SAI) could be utilized to distribute engineered pathogens anytime those in power wish. The collective health of the human race has already been horrifically compromised from what we conclusively know they are spraying above our heads (countless lab tests prove this), what might they be spraying that we don’t yet know about? If they are not yet spraying pathogens, what is to stop them from doing this at any point of their choosing? The spraying must be exposed and halted, it’s up to all of us to engage in this battle to expose the truth.
Dane Wigington
geoengineeringwatch.org
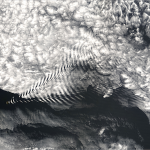
The World Awakens: America Sleeps – Chemtrails from Around the Globe, a Satellite View

Source: Natural Society, article by Christina Sarich
There are millions of people in the United States who are still ‘asleep at the wheel’ when it comes to awareness about geo-engineering programs for weather control and chemtrails. While Americas celebrate one of the most important dates for ‘freedom,’ we allow our governments to continue to pollute the planet with chemtrail dumps and aerosol spraying. There is evidence around the world that proves this phenomenon is happening, even if the con-job of the military industrial corporatocracy continues to leave most of us hoodwinked.

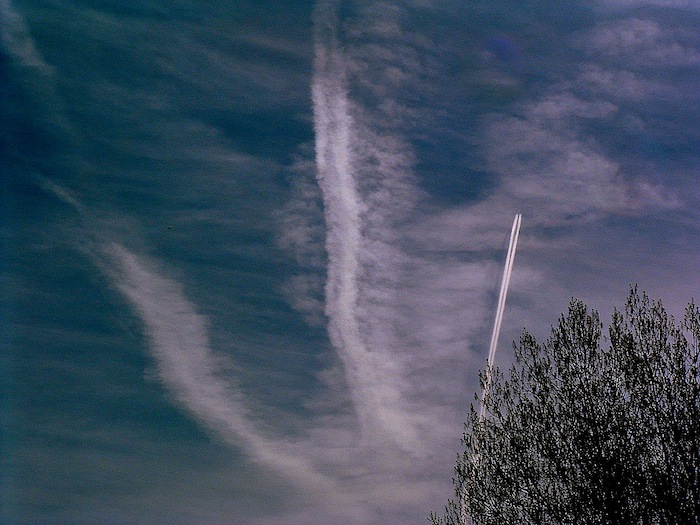
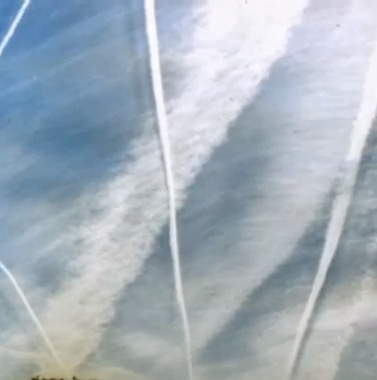
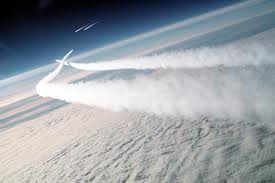
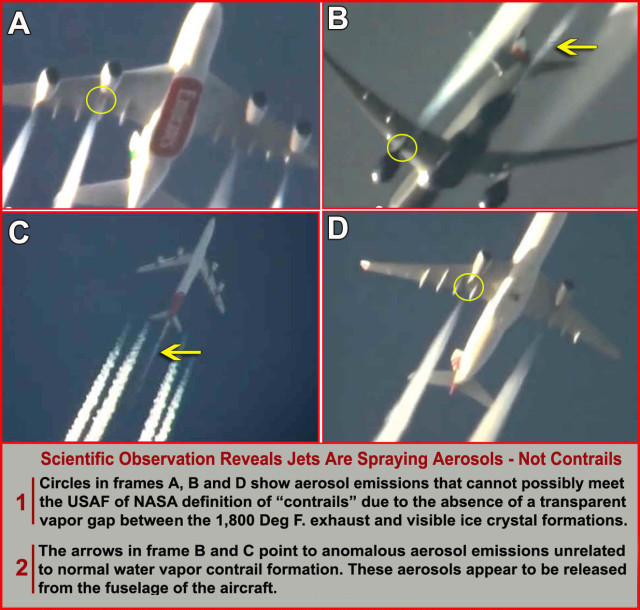
If You Think These Are Just “Contrails” Think Again – Here’s What They Really Are
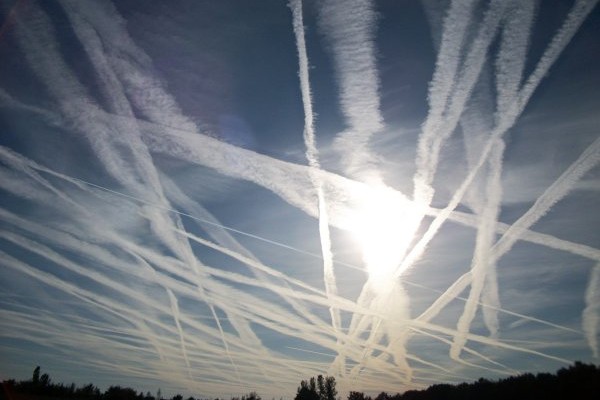
More and more credible authors and sources are making their voices heard in the battle to expose and stop the climate engineering insanity. The momentum of geoengineering awareness is growing by the day, the undercurrent of people who are waking up is expanding exponentially. The climate system is unravelling, the die off of wildlife is shocking, human respiratory ailments and diseases are going off the charts. Though there are countless sources of destruction and contamination to our once pristine planet, mathematically speaking, global climate engineering is the greatest act of human destruction ever waged against nature. Geoengineering is nothing short of all out weather warfare against life on our planet. My sincere thanks to Arjun Walia from “Collective Evolution” for his ongoing efforts to expose dire issues and for his article below which addresses the most critical issue of all.
Dane Wigington
geoengineeringwatch.org
Climate Engineering, Aluminum, And Alzheimer’s

There is no hiding from the toxic brew of heavy metals and chemicals (from global climate engineering programs) floating down through the atmosphere forcing us all to inhale it with every breath. Aluminum is the primary element named in numerous geoengineering patents. Extreme quantities of this highly toxic heavy metal is showing up in lab tests of precipitation from around the globe. If it’s in the rain, it’s in the air. Aluminum has been connected to Alzheimer’s disease by peer reviewed studies, how is it that the “Alzheimer’s Association” refuses to acknowledge this fact? Who is pulling the strings in the Alzheimer’s Association? Why do they want to hide the aluminum/Alzheimer’s connection? The article below is a very complete summary of the dangers aluminum poses to the human neurological system and the body as a whole.
Dane Wigington
geoengineeringwatch.org


10/18/2014 – Geoengineering Watch Radio
Alzheimer’s association prohibiting Dane from associating the disease with aluminum. Aluminum manufacturer sponsoring Alzheimer convention. Nurse who treated dead ebola patient allowed by CDC to fly with health symptoms. Descending spiderwebs blanketing fields contains aluminum and barium. “Acetone” odor reported ot NJ environmental agency. Retired police office calls in, exposes that they know what’s going on but are afraid to speak up. How to get involved.
One More Toxic Blow To California

As if things in California are not bad enough already, now another program of toxic insanity is added to the mix. On top of the horrific highly toxic drought inducing spraying from the ongoing climate engineering programs, and the poisoning of California’s remaining ground water with the toxic industrial waste injection wells, now the whole State is being lined up for yet another layer of toxic pest spraying. How much contamination can ecosystems take before nothing is left alive? In the last ten years the terrestrial and aquatic insect populations in Northern California’s Shasta and Siskiyou Counties have already declined some 90% as measured by former USFS biologist Francis Mangles who has done such monitoring for over 30 years. The die-off appears directly related to the toxic metal and chemical fallout from the totally out of control climate modification spraying programs. Already there are almost no insects for birds, bats and fish to eat. Now the State of California is going to kill off what little is left with yet more chemical spraying which will also rain down on an unsuspecting population. We are all passengers on a runaway train of total insanity. It’s not just the power structure that is to blame but also each and every individual that has allowed things to get this bad. Even more blame should be laid on all those that are carrying out the orders of the power structure in exchange for a paycheck. It’s up to us, the population, to hold these people responsible. This means turning off the football games and “American Idol” in order to engage in the fight for the common good. The paradigm we have all known is in its death throes, it’s over and it’s not coming back. If we are to have any life left on our planet to pass on to our children we must all act now, not later. Tomorrow is too late, we have only today. The latest ecocide program to be implemented by the state of California (and the federal power structure that orchestrates the state) is below, I am grateful to my friend Rosalind Peterson for bringing this latest spraying program to my attention.
Dane Wigington
geoengineeringwatch.org
FEMA Pandemic Rehearsals And The Ebola Fiasco
What a true circus of insanity we all find ourselves in. The obvious orchestrations of events and scenarios that are closing in on us unfortunately still do not seem so apparent to many. Our biosphere is collapsing, the entire planet is now completely contaminated from countless sources, and now there is the manipulated threat of Ebola to contend with. Do those that help to carry out the insanity (as their job) ever consider that they are going to go down with the rest of us if they continue to do the bidding of those in power? Many are beginning to wake up, this fact makes the global elite more dangerous than ever. From the spraying of toxic metals and chemicals in our skies to the playing of the Ebola card, the stakes are more dire and more immediate than ever. Those who are already awake need to open the eyes of others around them, the battle to expose and stop the psychopaths that run our world is a responsibility that must be carried by us all.
Dane Wigington
geoengineeringwatch.org
The Human Race Is Descending Into Extinction: A Former Reagan Cabinet Official Speaks Out
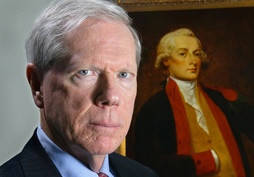
Dr. Paul Craig Roberts was Assistant Secretary of the Treasury for the Reagan administration. Mr. Roberts has constantly been an outspoken voice of facts and reason in an increasingly chaotic and criminal world run by global powers that are unarguably completely out of control. About 4 weeks before the article below was released, I communicated with Dr. Roberts on the issue of global geoengineering (as I am sure some others have also). I expressed to him that his voice would bring great credibility to the cause of raising public awareness on the critical climate engineering issue. Though he stated his reluctance to address the subject as it was not his area of expertise, true to his courageous character, Dr Roberts put out the article below which covered the climate engineering issue (along with other critical subjects) shortly after our exchange.
Dane Wigington
GeoengineeringWatch.org

Alzheimer’s Association Refuses To Allow GeoEngineeringWatch.org To Sponsor Their Event

Dane Wigington
geoengineeringwatch.org
The “Alzheimer’s Association” has recently refused to allow geongineeringwatch.org to sponsor their fundraising event scheduled in Northern California for October 18, 2014. I tried to support their cause by purchasing an information booth for the standard $500 dollar donation they ask of all sponsors, but in my case they refused to allow this donation. Thus, the “Alzheimer’s association” has tried to block our efforts to raise awareness of the primary source of aluminum contamination in the overall environment. Even more astounding, the “Alzheimer’s Association” flatly denies any link between aluminum and Alzheimer’s disease.
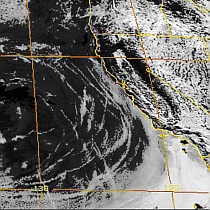
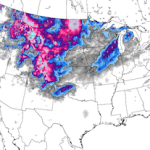
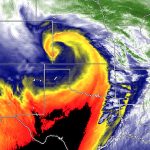
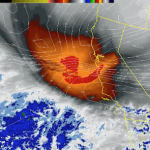
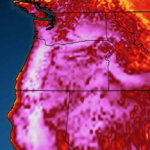
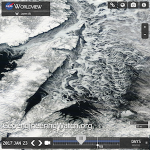
Pentagon Focus Is On The Climate As They Blow Apart Another Storm In California

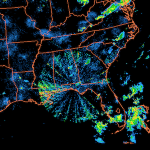
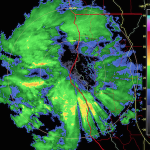
Those that believe the US Department of Defense would ask for the public’s permission before they would interfere with the climate should wake up to reality. Take a good look at the satellite photo below. You don’t need to know much about meteorology to see what looks like giant paint brush strokes through the image from just off the California coast all the way through the western states into Canada. This effect is due to massive aerosol spraying of the incoming storm front, once again robbing California of desperately needed precipitation.


