
Search Results for: arctic ice
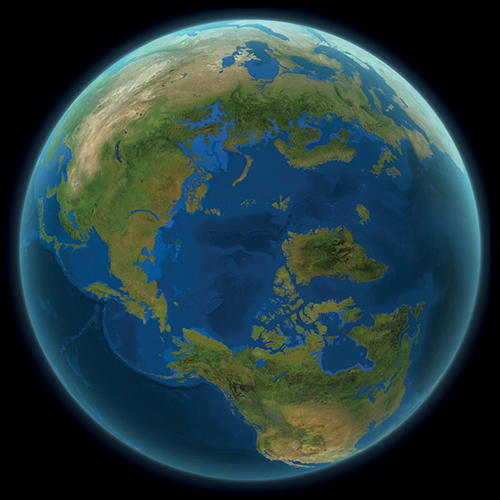
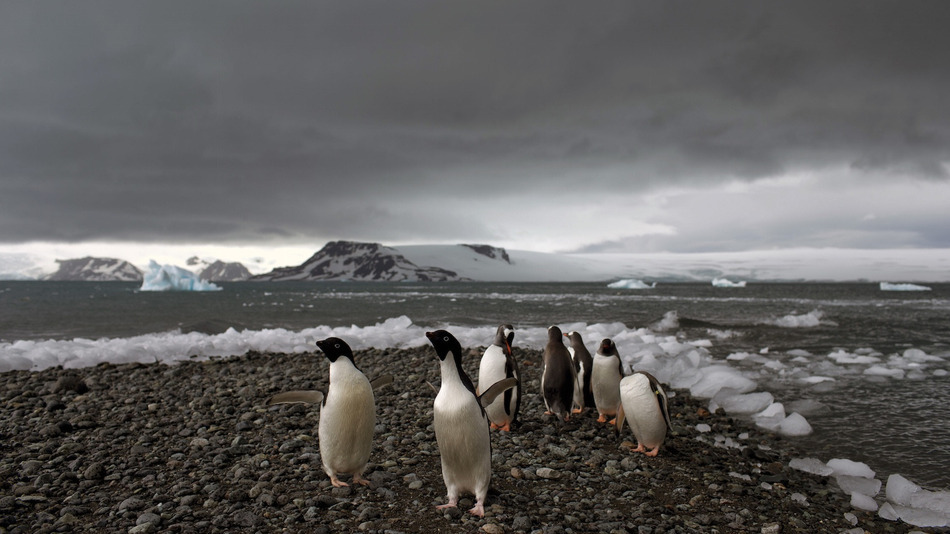
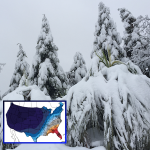
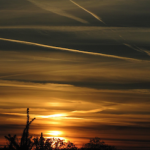
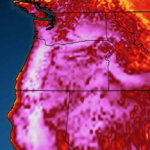
What The World Would Look Like If All The Ice Melted

Source: National Geographic

If we keep burning fossil fuels indefinitely, global warming will eventually melt all the ice at the poles and on mountaintops, raising sea level by 216 feet. Explore what the world’s new coastlines would look like.
This story appears in the September 2013 issue of National Geographic magazine.
The maps here show the world as it is now, with only one difference: All the ice on land has melted and drained into the sea, raising it 216 feet and creating new shorelines for our continents and inland seas.
There are more than five million cubic miles of ice on Earth, and some scientists say it would take more than 5,000 years to melt it all. If we continue adding carbon to the atmosphere, we’ll very likely create an ice-free planet, with an average temperature of perhaps 80 degrees Fahrenheit instead of the current 58.
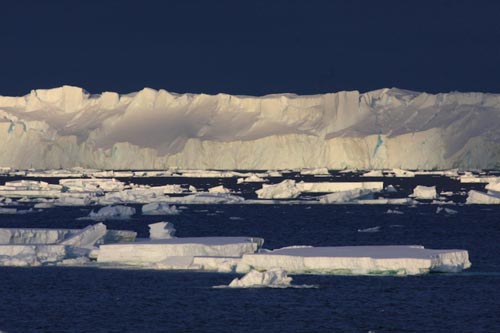
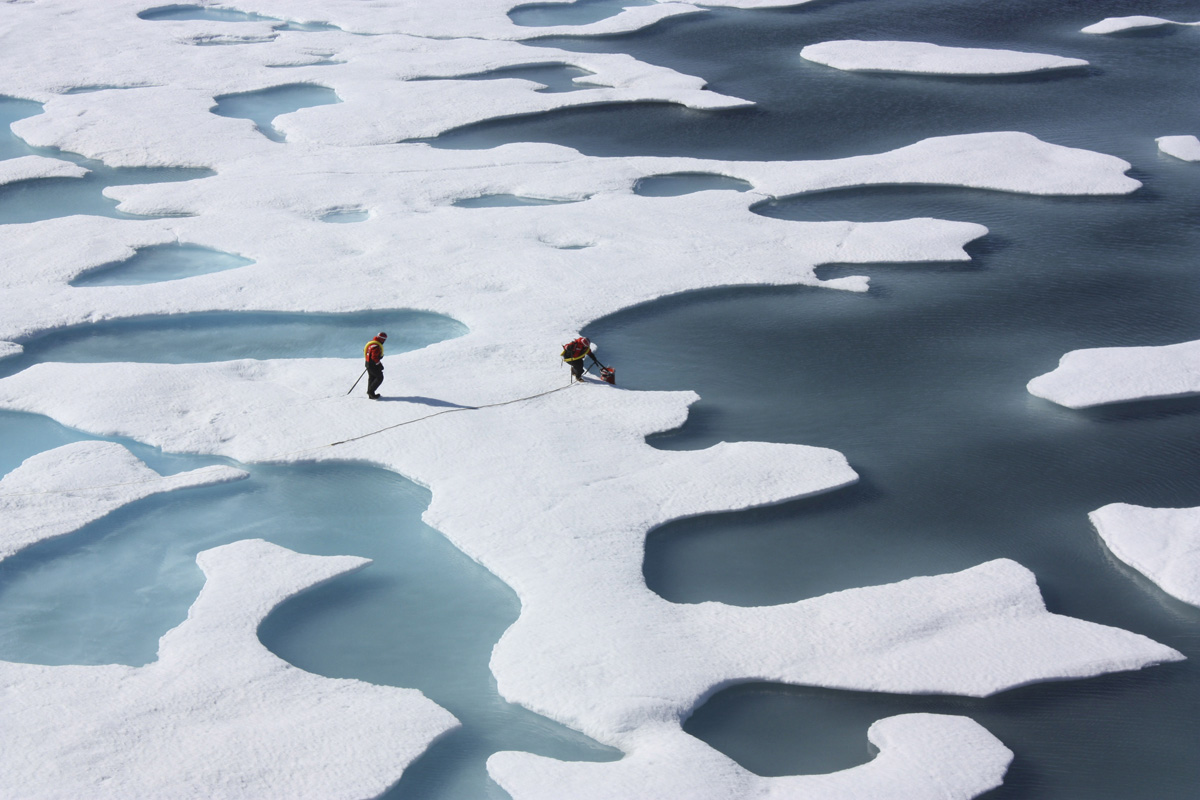
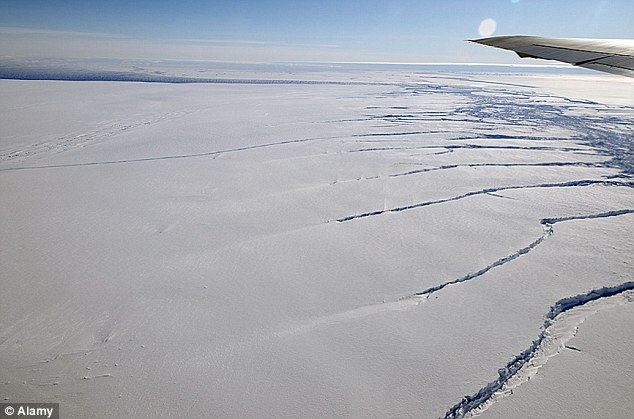
East Antarctica Is Melting From Above And Below
Source: Climate Central
East Antarctica is remote even by Antarctic standards. Harsh winds and ocean currents have largely cut off the region from the rest of the world.
That’s left its massive stores of ice largely intact, especially compared to West Antarctica where a massive meltdown is underway that could raise seas by 10 or more feet in the coming centuries. But as carbon pollution warms the air and the ocean, there are signs that the region’s stability is under threat. Two new studies of different ice shelves — tongues of ice that essentially act as bathtub plugs — have seen major melting that could portend a less stable future for the region.
So first, about those ice shelves. They are indeed like bathtub plugs. Except instead of keeping water in a tub, they keep ice on the continent of Antarctica. That’s good because when it ends up melting into the ocean, it causes seas to rise. East Antarctica contains about two-thirds of all the ice in Antarctica so its stability is crucial for the world’s coastal areas.
Captain Cook’s Detailed 1778 Records Confirm Global Warming Today In The Arctic
Source: Phys.org
Passengers simmered in Jacuzzis and feasted on gourmet cuisine this summer as the 850-foot cruise ship Crystal Serenity moved through the Northwest Passage.
But in the summer of 1778, when Capt. James Cook tried to find a Western entrance to the route, his men toiled on frost-slicked decks and complained about having to supplement dwindling rations with walrus meat.
The British expedition was halted north of the Bering Strait by "ice which was as compact as a wall and seemed to be 10 or 12 feet high at least," according to the captain's journal. Cook's ships followed the ice edge all the way to Siberia in their futile search for an opening, sometimes guided through fog by the braying of the unpalatable creatures the crew called Sea Horses.
More than two centuries later, scientists are mining meticulous records kept by Cook and his crew for a new perspective on the warming that has opened the Arctic in a way the 18th century explorer could never have imagined.
Working with maps and logs from Cook's voyage and other historical records and satellite imagery, University of Washington mathematician Harry Stern has tracked changes in ice cover in the Chukchi Sea, between Alaska and Russia, over nearly 240 years.
The results, published this month in the journal Polar Geography, confirm the significant shrinkage of the summer ice cap and shed new light on the timing of the transformation. The analysis also extends the historical picture back nearly 75 years, building on previous work with ships' records from the 1850s.
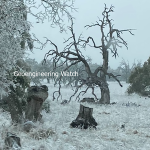
The Engineered Winter Deception, Chemical Ice Nucleation, And Ice Boulders

Dane Wigington
geoengineeringwatch.org
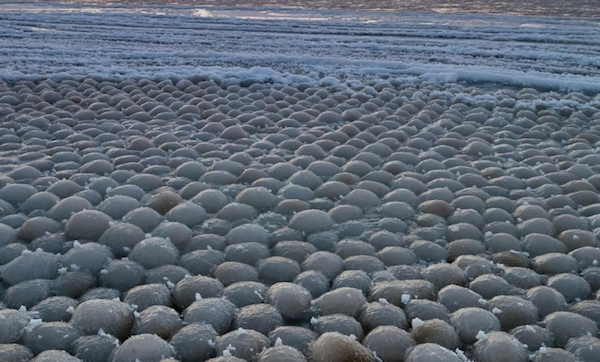
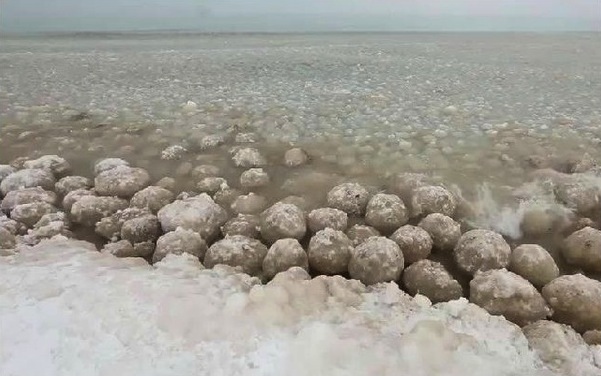
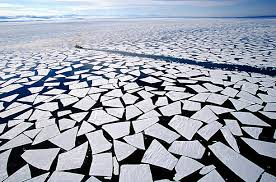
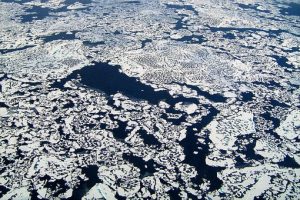
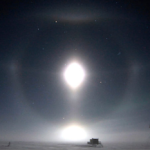
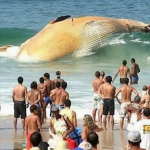
Headlines from Siberia reveal an incident of uniformly spherical "ice boulders" suddenly washing up on the shores of Nyda, Russia. Are we to believe this is only an "act of nature" as "official sources" have told us?

Photo credit: Ekaterina Chernykh
Why would the "ice boulders" occur with Arctic sea ice at record low levels? Why would perfectly spherical "ice balls" occur at all? 2012 was the previous record Arctic ice low for this time of year, 2016 has shattered that former record.
Why would such formations occur from the record warm Arctic Ocean? Sea temperatures in some zones of the Arctic Ocean are as much as 25 degrees above the 30 year average. This average was taken from 1981-2011, when the ocean temperatures were already warmer than the pre-industrial era.
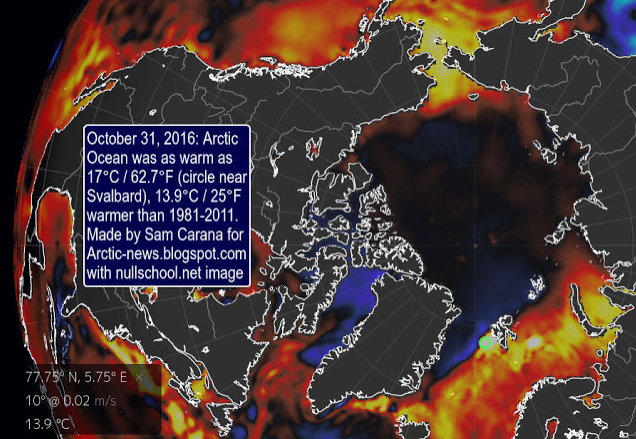
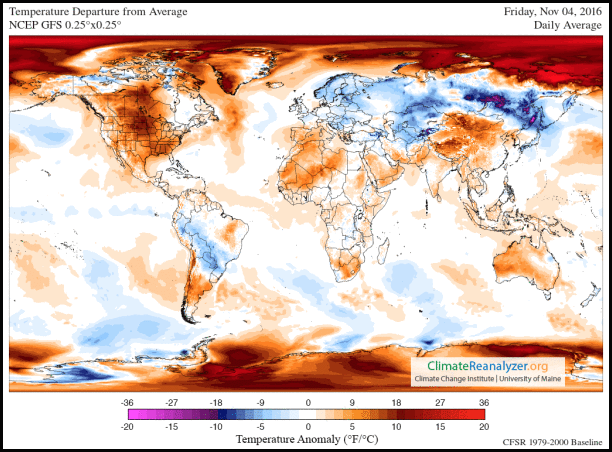
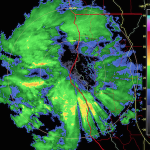
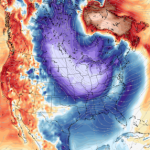
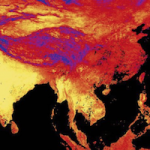
Why are governments and media doing all they can to hide the reality of the record warm Arctic from the public? There are many reasons, none of them are benevolent. Temperatures in the polar regions are going completely off the charts as the "departure from normal temperature" map below makes clear.
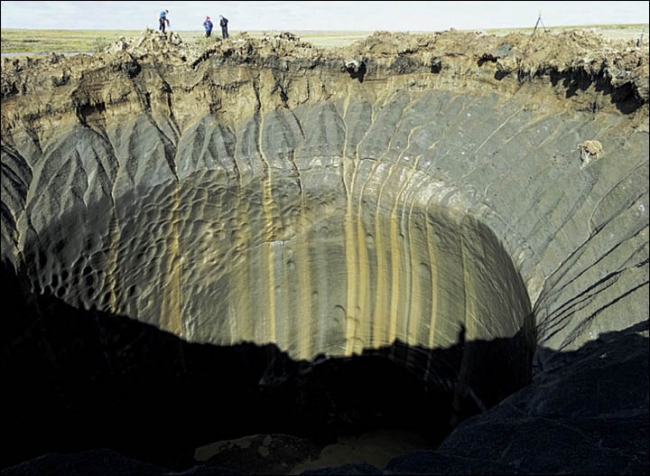
Siberia is undergoing massive engineered cooling assaults, but the extremely rapid warming of the planet is undeniable and climate engineering is helping to fuel the overall fire. Are the climate engineers trying desperately to reduce the methane "blowouts" that are occurring in Siberia due to rapidly thawing methane permafrost deposits? Whatever the case, the short term engineered (and highly toxic) cool-downs come at the cost of a worsened overall warming.
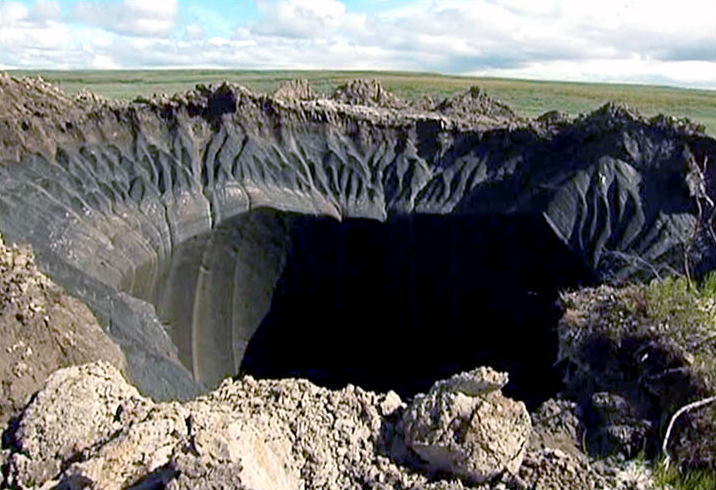
Photo credit: Andrey Naumenko
Again, the "experts" tell us that the "ice boulder" phenomenon is a "natural" occurrence. But if this is so, why is there no long term historical record (or pre 1945 photographs) of this phenomenon occurring? There is no such long term record (pre 1945) because the ridiculously uniform "ice boulders" are absolutely not natural. The climate engineeres became very active in the polar regions immediately after the end of WWll, historical data confirms this fact. Again, about the ice anomalies being "natural, the "experts" are simply lying, as they are paid to do. We are all swimming in a sea of lies and deception that is propagated by countless individuals in academia, media, and "official sources", who have completely betrayed humanity in exchange for a paycheck and a pension. When will the population reactivate their sense of sanity and reason? When will the population recognize that our geoengineered skies should not look like they do? When will the population face the fact that steel structure high-rise buildings (building 7 on 911) don't just fall down because of an office furniture fire on the lower floors? And why can't the masses discern that miles of shorelines covered with almost perfectly uniform and symmetrical "ice boulders" is completely unnatural?
DW
Below is an article on chemical ice nucleation that I first posted in November of 2015. The information it contains is every bit as relevant now as it was almost exactly one year ago.
The Engineered Winter Deception, Chemical Ice Nucleation
All around the globe, extreme, destructive, and unprecedented "frozen precipitation" events are occurring. A great many of these events begin at temperature ranges far above the freezing point (though temperatures on the ground can drop precipitously as the nucleation process unfolds). Why? Most have never heard of "chemical ice nucleation for weather modification", but patents exist for this process and the Chinese government has long since admitted to engineering frozen precipitation events. The 90 second video below is astounding, a 200 foot wide river of ice flowing through the Saudi desert on November 2nd, 2015.
Extreme hail events are happening with alarming frequency, often in the most unlikely locations where such storms have not historically occurred.
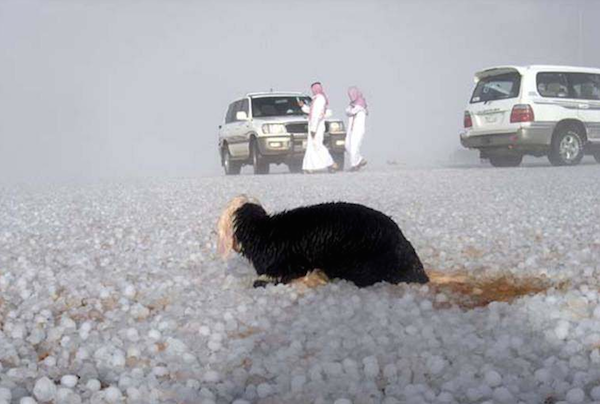
"Ice storm" hits Saudi Arabia in Early November, 2015
When moisture laden storms are saturated with artificial/chemical ice nucleating elements (due to the destructive attempt by the climate engineers to temporarily cool-down ground temperatures on the ground), storms that would have been a deluge of rain become unprecedented onslaughts of frozen precipitation.

Record hail storm in Quito, Ecuador, February 14, 2015
The damage being inflicted by the rapidly increasing hail storms is massive and growing.
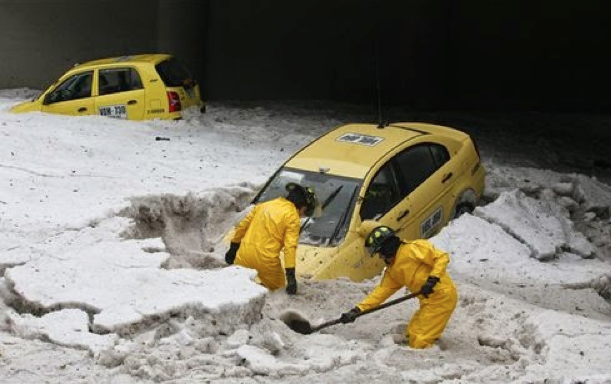
Record hail event, Bogata Columbia, February 22, 2015
Africa is also being subjected to unprecedented hail events.
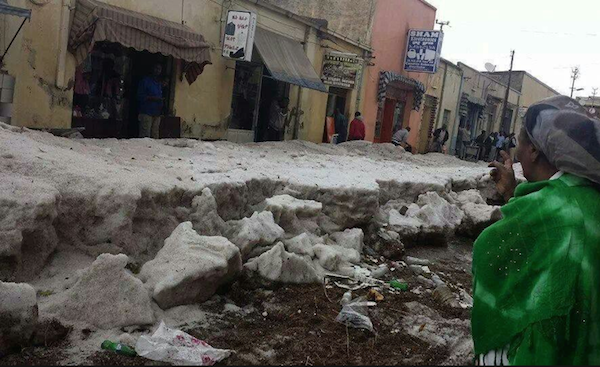
A record shattering 3 feet of hail is dumped on the East African nation of Eritrea, March 14, 2014
Below is a shocking photo of "ice balls" piled up on the shores of Lake Michigan. Why is there no long term historical record of such a profound phenomenon? Chemical ice nucleating materials form a central core of ice that builds up around itself. The motion of the waves then contribute to the spherical shape.
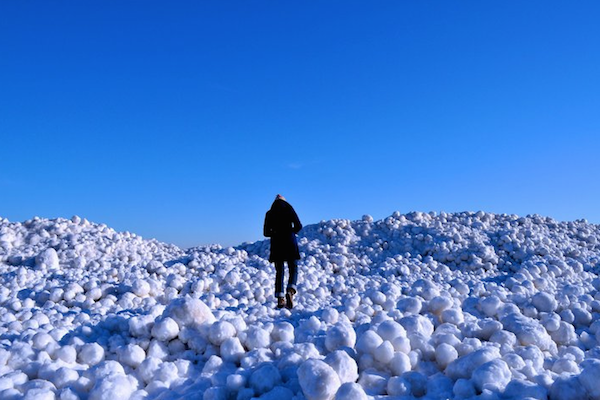
"Ice balls" have formed and accumulated on Lake Michigan in the last few years, why? Such "ice balls" have even formed on lake water that was 40 degrees, how is this possible at temperatures far above the normal freezing point? Without chemical ice nucleation, it isn't possible.
What is occurring on the shores of distant seas? Yet more "ice balls" have appeared in recent years.

"Ice balls" on the Baltic Coast in Northern Poland. "Official" sources say this recent unprecedented phenomenon is just "natural", are we to believe them?
Other European countries are noting the same phenomenon.
Ice balls on the coast of Finland. The "official" explanation for this recent mysterious anomaly? Again, we are told it is a "natural" occurrence.
How natural do these "ice pancakes" look in the photo below?

CNN news called these "ice pancakes" "mysterious". This phenomenon has also been observed on various lakes and rivers in recent years. It is the extreme uniformity of these formations that separates them from any natural phenomenon. Chemical nucleation materials are the core causal factor that produce the recent rash of profound ice formations.
"Freezing rain" has now become commonplace. Extreme "ice storms" are wreaking havoc all over the globe. Depending on atmospheric conditions and temperatures, precipitation from storms that have been sprayed with chemical ice nucleating materials can reach the ground before actually freezing.
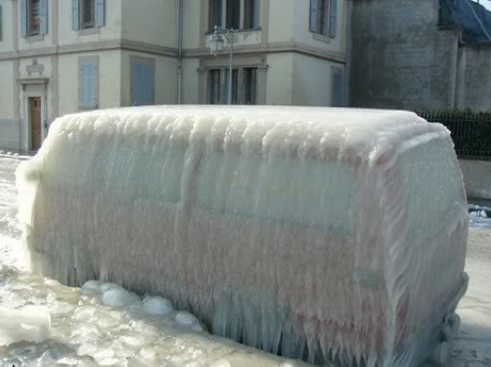
This vehicle photo was taken in Versoix, Switzerland. Formerly unprecedented ice storms have now become the norm as the geoengineers do their best to create temporary chemical cool-downs in a rapidly warming world.
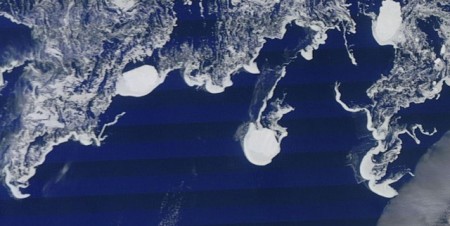
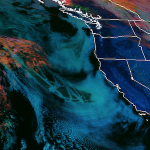
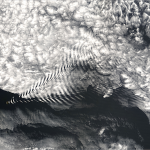
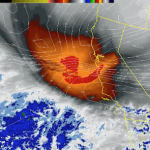
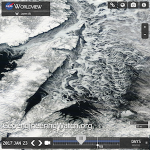
Where can the most profound chemical ice nucleation examples be seen? The satellite photos below show completely unnatural ice formation structures on the Arctic ocean, September 15th, 2015. Arctic ocean temperatures have persisted at record high levels and the warming continues to worsen. Why would ice form in open water under such conditions, and in a manner that is completely different than the normal ice pack winter expansion? And all this during a year that has had record warmth and record ice melt in the Arctic? Surface ice formation on record warm seas worsens the overall warming by trapping the heat below.

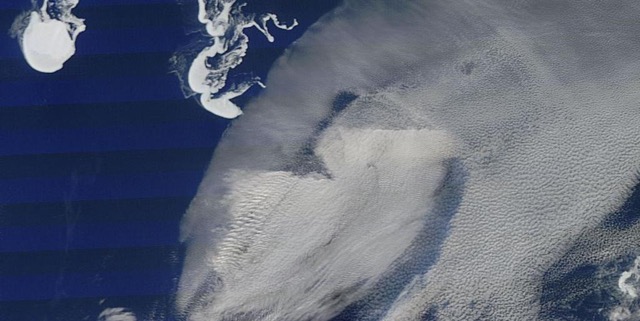
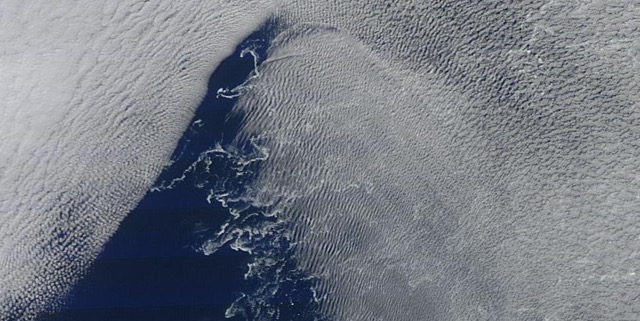
Another satellite photo taken over the Arctic Ocean, September 15, 2015. Extremely anomalous sea surface ice formation is clearly evident.
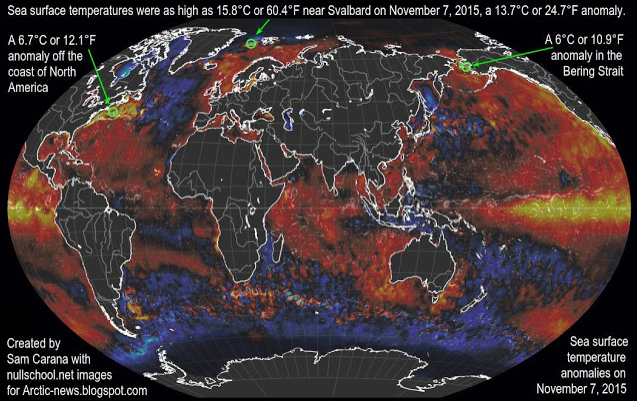
Even into November, 2015, astoundingly high ocean temperatures have persisted and continue to shatter records. The map below clearly shows that sea surface temperatures were as much as 24.7 degrees ABOVE NORMAL in the Arctic ocean on November 7, 2015.
The excerpt below was taken from a recently posted Article from "Arctic News", it should be read carefully. Arctic news describes the effects of atmospheric particulates (primarily from geoengineering which Arctic news refuses to admit to). They then state clearly the negative overall effects of these particulates (again, a result of geoengineering). And at the end of the article from which this excerpt was taken, Arctic News and the Arctic Methane Emergency Group calls for global geoengineering to be deployed immediately, as if it has not already been going on for over 6 decades in clear view and causing catastrophic effects. We must all diligently "sift the baby from the bathwater" so to speak. Though the front line data from Arctic news is accurate and verifiable from other sources, their constant call for geoegineering to commence is extremely alarming.
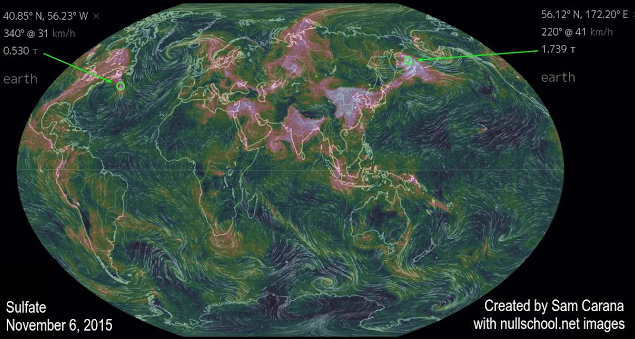
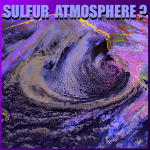
Aerosols
Particulates, in particular sulfate, can provide short-term cooling of the sea surface. Large amounts of sulfate are emitted from industrial areas in the east of North America and in East Asia. On the Northern Hemisphere, the Coriolis effect makes that such emissions will typically reach areas over the nearby ocean to the east of such industrial areas, resulting in the sea surface there being cooled substantially, until the particulates have fallen out of the sky. Since the sulfate is emitted on an ongoing basis, the cooling effect continues without much interruption.
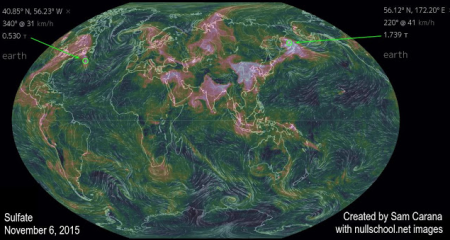
This sulfate has a cooling effect on areas of the sea surface where ocean currents are moving warm water toward the Arctic Ocean. Because the sea surface gets colder, there is less evaporation, and thus less heat transfer from the ocean to the atmosphere during the time it takes for the water to reach the Arctic Ocean. As a result, water below the sea surface remains warmer as it moves toward the Arctic Ocean.
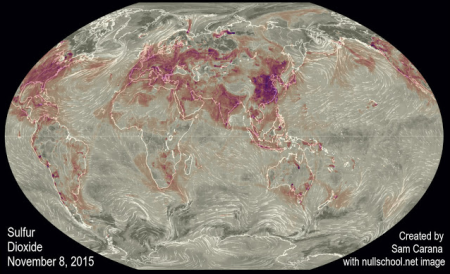
Similarly, as illustrated by above image, sulfur dioxide emitted in industrial areas in North America and East Asia can extend over the oceans, cooling the surface water of currents that are moving water toward the Arctic Ocean.

So the overall conclusion from Arctic News is that the atmospheric particulates are making a bad situation worse, not better. Yet, they continue to call for geoengineering deployment as if that is not the source of "atmospheric pollution" they have just condemned.
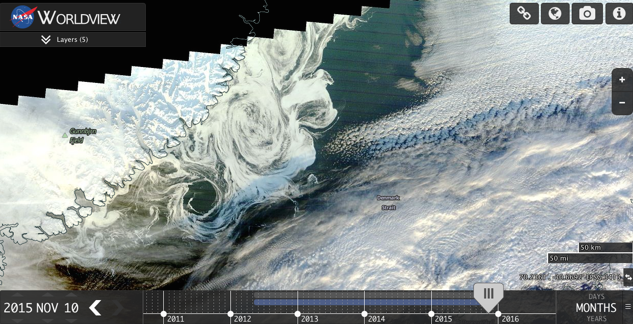
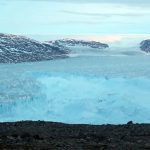
Below is a recent satellite photo of the sea surface off the coast of Greenland. Again we see an extremely anomalous and unprecedented pattern of ice formations like those shown earlier in this article. The massive chemical ice nucleation efforts in the Arctic, by the geoengineers, is undeniable.
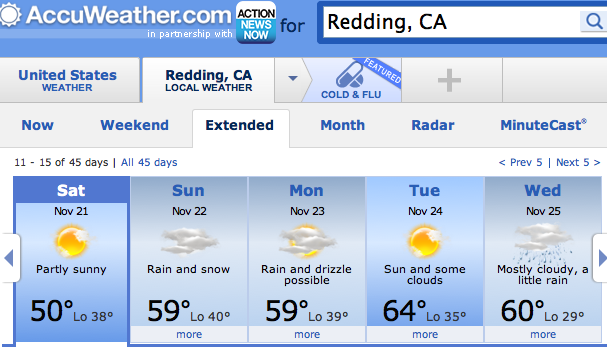
The AccuWeather "forecast" (scheduled weather) for November 16-20, 2015, shows snow with a daytime high of 59 degrees and a night time low of 40 degrees. Why?

In the next map, we see snow again called for on the 22nd with the same temperatures as the earlier forecast, yet, on the 25th only rain is called for with much colder low temperatures? Snow is now often reported at temperatures up to 50 degrees and even above, welcome to the world of chemical ice nucleation. As previously mentioned, there are patents for such processes, and again, the Chinese scientists have openly admitted their programs to create engineered snow storms.
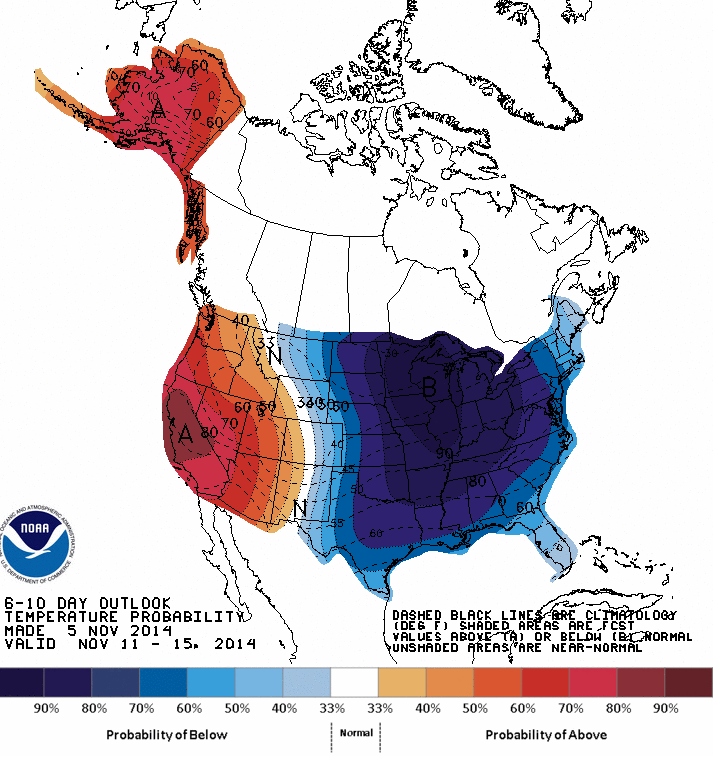
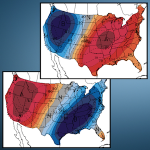
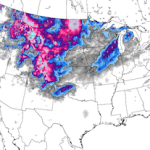
What scenario are the geoengineers creating in the US with their chemical ice nucleated cool-downs? The exact antithesis of what has been the case in the US for the previous 3 winters. The extreme scenario shown in the most current NOAA map below is historically unprecedented, but in recent years has become the norm.
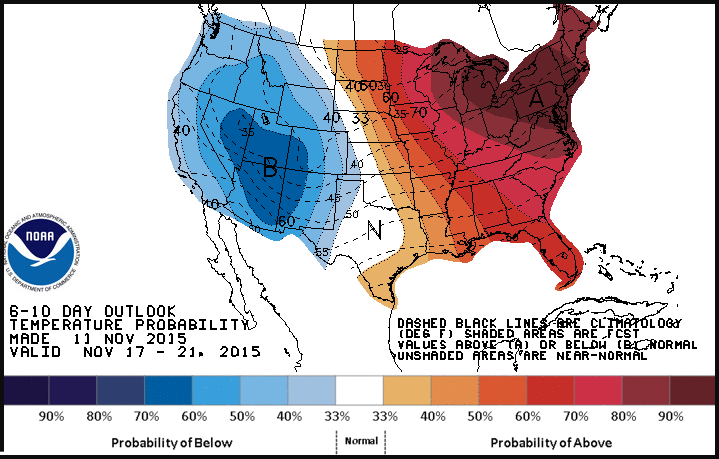
The "scheduled" weather from the geoengineers is for temperatures to be up to 20 degrees below normal in the West, and 20 or more degrees above normal in the East.
Chemical ice nucleation of storms and precipitation does create a cold dense layer of air on the ground level that can drastically lower temperatures temporarily. But what is the overall cost? A decimated climate system, a worsened overall warming of the planet, and total contamination of the atmosphere and surface of our planet (due to the highly toxic fallout from the climate engineering programs). If you think your winter weather is natural, think again. Exposing the ongoing climate engineering insanity is challenge we must all face head on, make your voice heard in this battle. Forward solid information to all those that need to know and don't. Make every day count in this most critical fight.
Dane Wigington
geoengineeringwatch.org
May be freely reprinted, so long as the text is unaltered, all hyperlinks are left intact, and credit for the article is prominently given to geoengineeringwatch.org and the article’s author with a hyperlink back to the original story.
Climate Engineering And The “Coming Ice Age” Narrative

Dane Wigington
geoengineeringwatch.org
When a society has been very successfully polarized by decades of carefully crafted propaganda, beliefs and wishful thinking can (and all too often do) take the place of actual investigation and fact based conclusions. Belief systems and biases can become so powerful that they completely override and block out evident and readily verifiable realities. The "coming ice age" false narrative is an epic example of blatant disinformation that has been pushed by special interest groups with an agenda of creating division and confusion within the population. Confusion and division in regard to the true state of the climate is exactly what the global power structure and the climate engineering cabal want to achieve. What is the real big picture on the front lines of the climate unraveling?
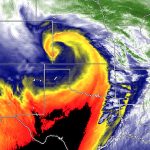
Hurricane "Alex" was an unprecedented January hurricane, and a harbinger of what is to come. Its impact on the Arctic ice was not covered by mainstream media.
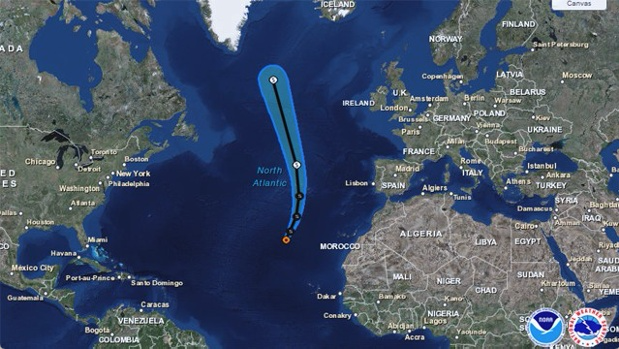
Hurricane Alex appears to have further fueled the ongoing extreme Greenland ice melt, even in the middle of winter. Geoengineering/solar radiation managment, and the global dimming chemical cloud cover effect it is creating, are also worsening the Greenland melt as recent studies prove.
We’ve seen unprecedented above-freezing temperatures at the North Pole coincident with record low daily sea ice extents. We’ve seen global temperatures hitting new, very extreme record highs. We’ve seen climate change related storms raging across the globe — flooding both the UK and the Central US, firing off record hurricanes during January in both the Pacific and the Atlantic — even as other regions swelter under record heat and drought. Now, it appears that Greenland is also experiencing an unprecedented melt during wintertime.
Over the past few days, just such a major heat-up has been underway across a large section of Western Greenland. Warm winds flowing off the North Atlantic — driven by hurricane Alex’s merging with powerful lows south of Greenland — have roared up over the southern coastal ranges. Meanwhile, warm, tropical air has infiltrated northward over Baffin Bay. The net result is temperatures approaching 20-40 degrees Fahrenheit above average (16 to 22 C above average) over a broad region of Western Greenland.
As the geoengineers orchestrate an early year cool-down in the Eastern US (in order to create the winter weather headlines they desperately need to fuel the climate confusion), the Arctic continues its ongoing meltdown with far above normal temperatures.
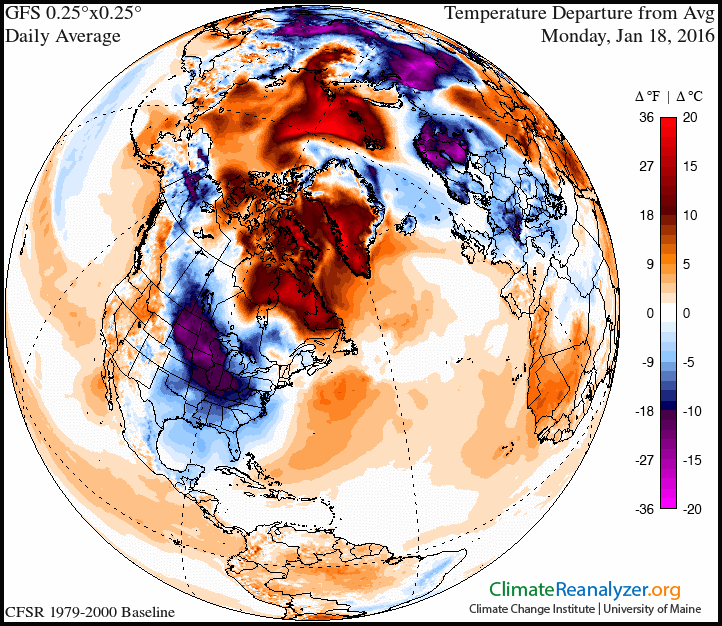
The corporate controlled media do not show temperature maps that cover the entire planet and which reflect the "departure from normal high temperatures" (like the map above). For this reason most populations continue to be blind to the bigger picture.
What about the "coming ice age" headlines that are seen on some news sites? The narrative is as far from reality as it could be. Excerpts from the most recent study on Earth's cycles of glaciation are below.
The advent of industrial society has since raised this level to about 400ppm. Add another 1,000 to 1,500 gigatonnes of carbon to the atmosphere, and the next ice age is virtually guaranteed to be postponed by 100,000 years, the Potsdam scientists say.
"The bottom line is we are basically skipping a whole glacial cycle, which is unprecedented," Andrey Ganopolski, who led the research team, told the Guardian. "It is mind-boggling that humankind is able to interfere with a mechanism that shaped the world as we know it."
The study reinforces the assertion that the Earth has entered a so-called Anthropocene geological age, marked by humanity's impact on the planet. An international scientific panel is working towards formally classifying the new epoch, with the middle of the 20th century suggested as a potential starting point for the new era.
What is coming for the US after the current climate engineering cool-down passes?
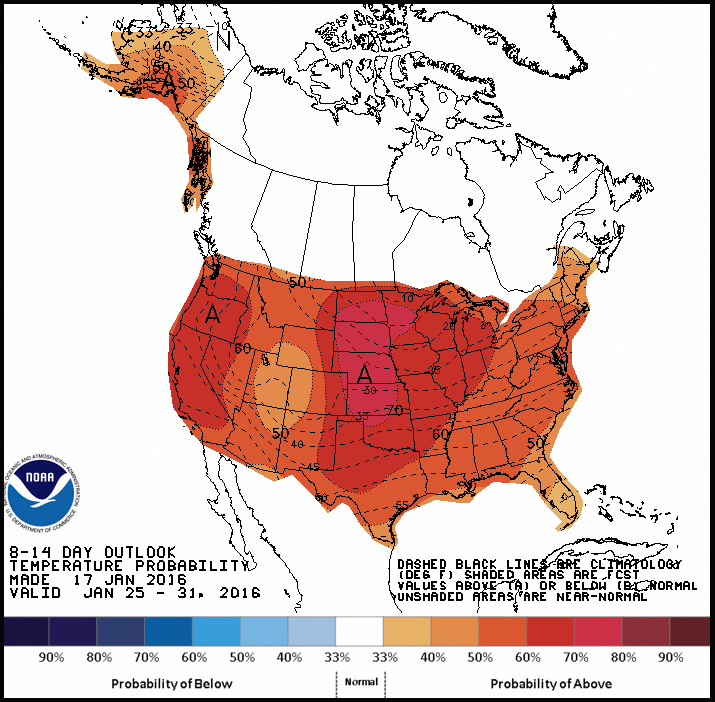
The NOAA "forecast" map above is for the last week of January, 2016 and predicts above normal temperatures for the entire country with far above normal temperatures in many regions. Each color band represents 2-3 degrees above normal. This map is no less than alarming and is a clear reflection of the rapidly warming planet. The intensifying "weather whiplash" is a direct result of the ever more desperate and destructive geoengineering insanity.
How do we effectively fight back against the global climate engineering/weather warfare assault? We start by learning to recognize blatantly false and theatrically hyped headlines, and completely engineered weather events. To do otherwise is to "toe the line" for the the geoengineers and the power structure they are a part of. Discovering the truth is not about believing anyone, it is about doing some real unbiased investigation from the front lines. Credibility is crucial in the battle to expose and halt global geoengineering, the greatest and most immediate threat faced by the human race short of nuclear cataclysm. The planet heating at blinding speed, geoengineering is helping to fuel the overall fire. Make your voice heard in this most critical effort for the greater good.
DW
Scientists Say Greenland Just Opened Up A Major New ‘Floodgate’ Of Ice Into The Ocean
Source: Washington Post (article by Chris Mooney)
As the world prepares for the most important global climate summit yet in Paris later this month, news from Greenland could add urgency to the negotiations. For another major glacier appears to have begun a rapid retreat into a deep underwater basin, a troubling sign previously noticed at Greenland’s Jakobshavn Glacier and also in the Amundsen Sea region of West Antarctica.
And in all of these cases, warm ocean waters reaching the deep bases of marine glaciers appears to be a major cause.
The new fast-moving glacier is the Zachariae glacier or Zachariæ Isstrøm, located in the far northeastern part of Greenland. In a new paper in Science, Jeremie Mouginot of the University of California-Irvine and his colleagues find that the ocean-based glacier, which contains 0.5 meters or a foot and a half of potential sea level rise, has begun a rapid retreat, especially since 2012. The glacier has lost fully 95 percent of the ice shelf that used to help stabilize it, they say, and now sports a 75 meter high ice cliff extending above the water (the glacier also extends hundreds of additional meters below it).
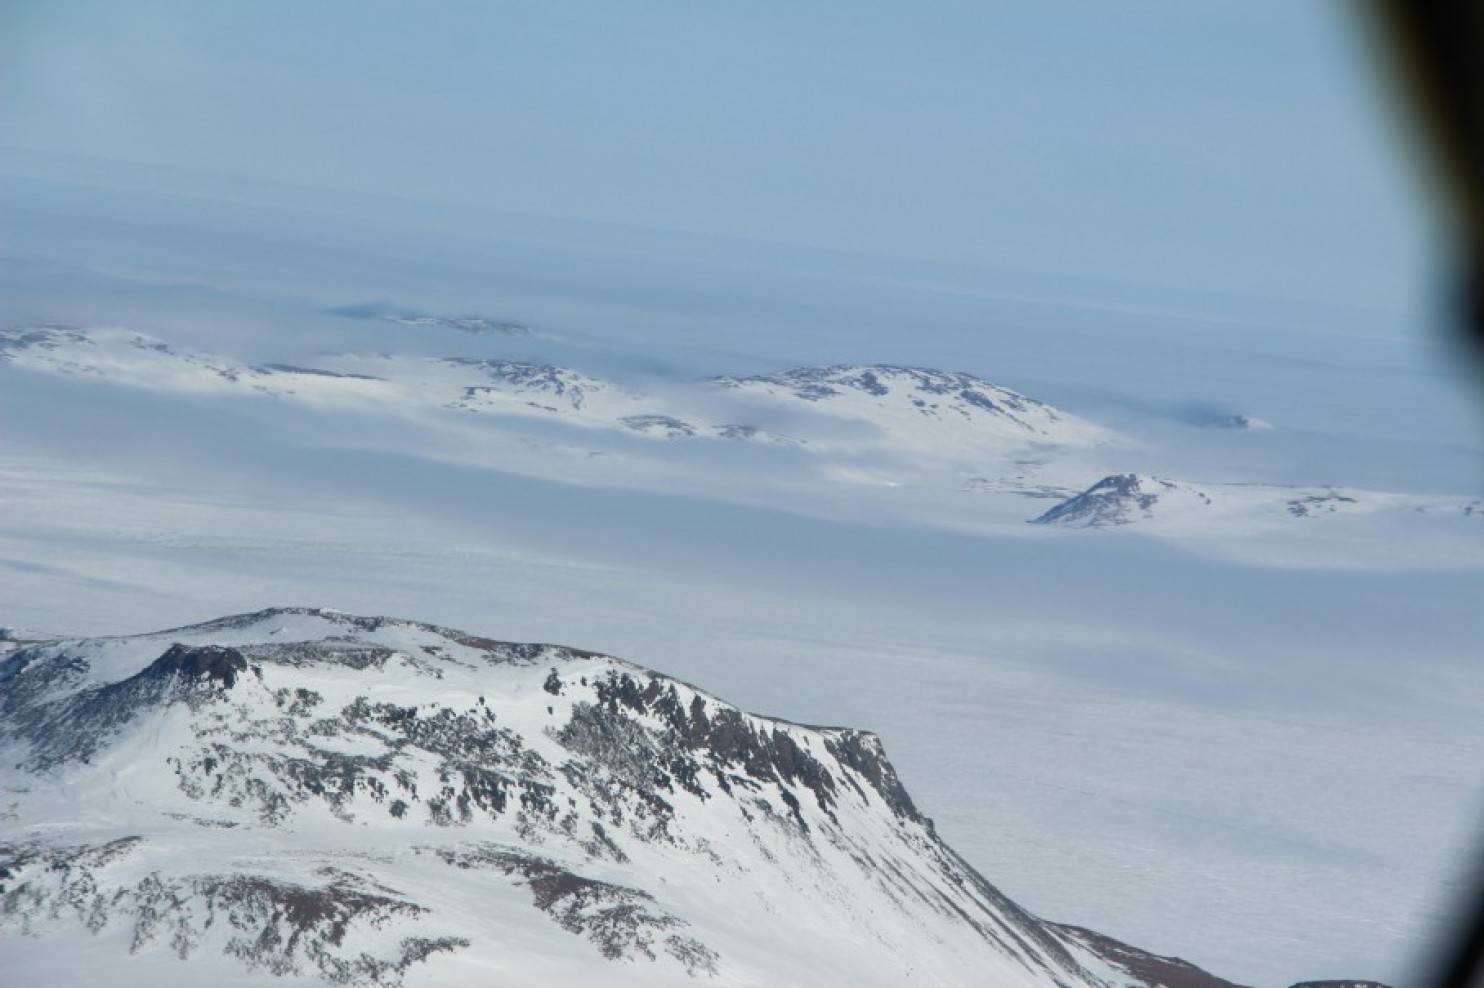
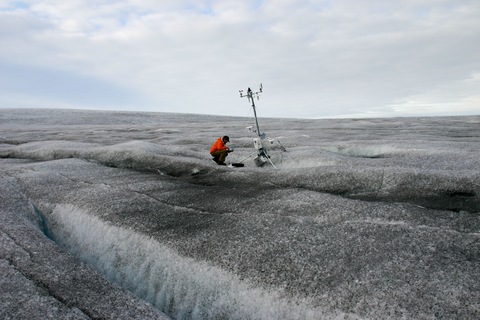
What Are The Climate Engineers Doing In The Arctic? Astounding Images, And Dead Scientists
Dane Wigington
geoengineeringwatch.org
The far north is out of site and out of mind for the vast majority of the population, but the importance of this region to the overall survival of life on Earth cannot be overestimated. The global power structure has long since believed they have the right to experiment with our planet's life support systems. They have always felt they had the right to permanently pollute and poison any region in the biosphere they wish in the pursuit of their agendas. Chemical ice nucleation is a primary tool for the geoengineers. It is a major weapon in their arsenal of insane, toxic, and destructive technologies. Geoengineered snow storms are wreaking havoc around the globe.
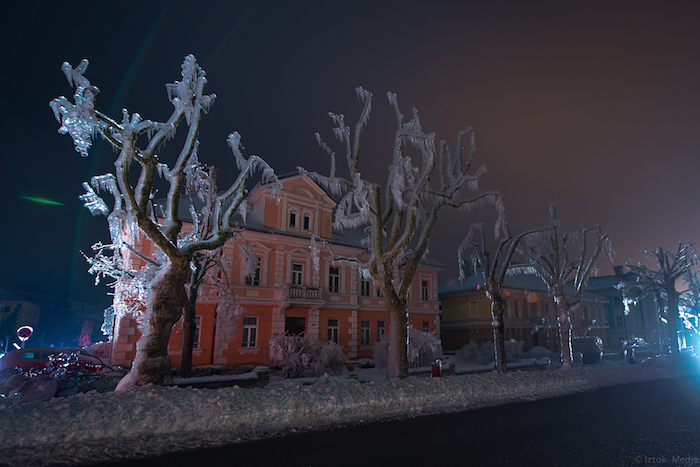
This image is from a record breaking ice storm in Slovenia in 2014. I personally communicated with contact in Slovenia who stated their citizens feel the country was the target of NATO climate modification programs because they were not complying with global power structure mandates and policy.
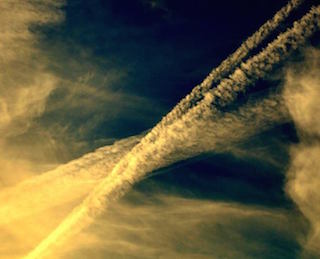
Chemical ice nucleation is a reality, lab tests prove this beyond any doubt. The 5 shocking satellite photographs below were taken in the Arctic Ocean on September 15th, 2015. What these images show is extremely anomalous ice formation in open water, far from any existing remaining ice. They also show extensive geoengineering aerosol cloud cover with very clear radio frequency signature patterns (my sincere thanks to anti-geoengineering activist Cori Gunnels for locating these alarming Arctic Ocean NASA satellite images).
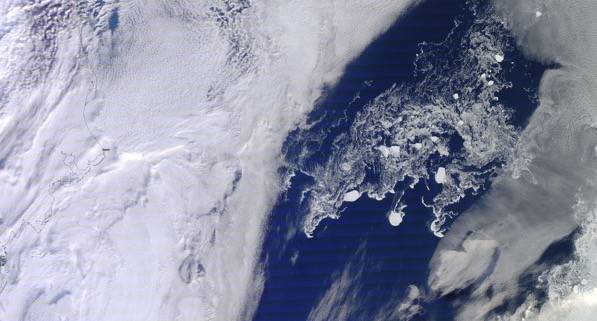
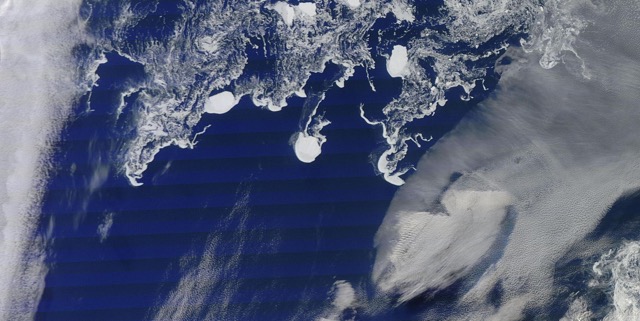

NASA satellite images taken September 15, 2015
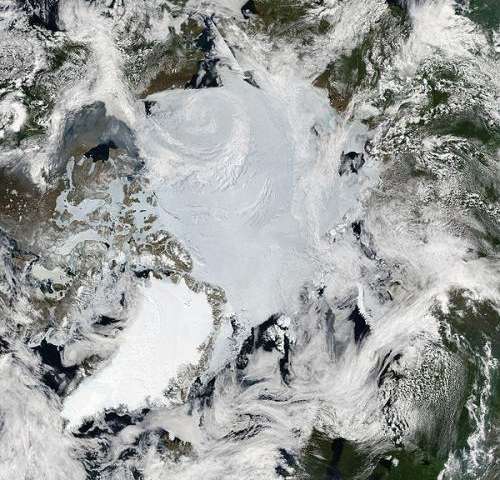
On the same day that the disturbing images above were taken, the power structure controlled National Snow And Ice Data Center (NSIDC) confidently made the statement below.
"sea ice extent dropped to 4.41 million square kilometers (1.70 million square miles), the fourth lowest minimum in the satellite record. ………… ice extent will now climb through autumn and winter".
"Ice extent" is very different from the ice mass (volume), which is at record shattering low levels as the latest satellite imagery below clearly shows.
Click image to enlarge
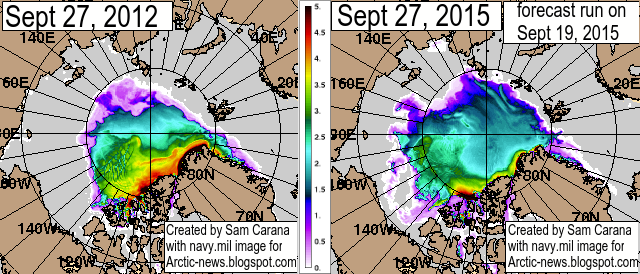
Arctic ice volume graphing
The graph between the two images is a gauge for Arctic ice thickness in meters. As the 2015 imagery shows, the thick multi-year Arctic ice is almost gone. Is the surface of the Arctic ocean being chemically ice nucleated with the same process that has created the unprecedented "ice boulders" on Lake Michigan in recent years? Even when water temperatures were far above freezing?
Unprecedented "Ice boulders" have appeared in Lake Michigan during recent years even at far above freezing lake temperatures
The following questions should be considered:
How can a very thin layer of sea surface ice statistically remain over large areas of ocean when such astonishing decreases in ice volume (mass) occurring at the exact same time? How can the ice "extent" statistically increase in early September (ahead of the normal "minimum" melt date) when we have record shattering global ocean temperatures? When we have just logged the hottest 12 month period globally, the hottest start to any year ever, the warmest summer ever, and the warmest August ever? And finally, when we consider that the Arctic is warming twice as fast as the rest of the world? What is really going on in the Arctic? Is there a connection between what the climate engineers are doing in the Arctic and the recent untimely deaths of three scientists that were investigating Arctic sea ice? How far will power structures go to hide climate engineering operations from populations?
Click image to enlarge
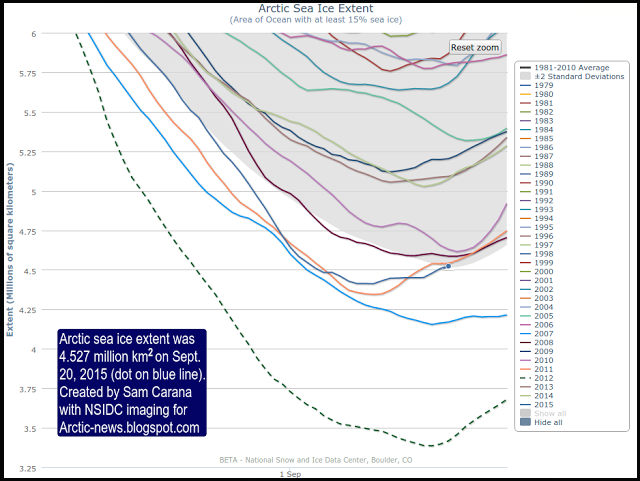
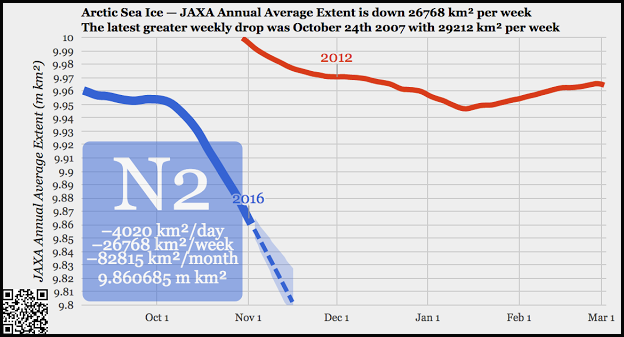
NSIDC shows a very anonymous upturn in Arctic ice "extent" near the middle of September
Though the ice extent (surface area) for 2015 was in an alarmingly downward trajectory as rapid melting took its toll, it suddenly turns statistically upward during the same window of time when the anomalous photos (shown earlier in this article) were taken. The power structure and the geoengineers do not want any headlines from the Arctic that would reveal the true extent of damage already done to the planet. They do not want any headlines that would potentially expose the climate engineering crimes that have been going on for well over a half century. Those in power will do everything they can to hide reality (from a population that is so far all too willing to stay uninformed) until the last possible moment. Climate engineering can create large scale temporary cooling, but at the cost of an even worse overall planetary warming. What is really going on in the Arctic? We must all examine the evidence and decide for ourselves. Geoengineering is not about the common good, it is about power and control at any price to the planet and the population. We must all do our part to expose and halt the climate engineering insanity.
DW
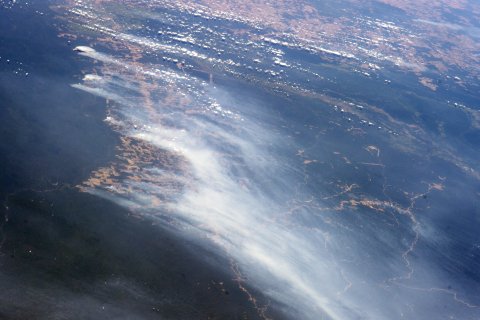
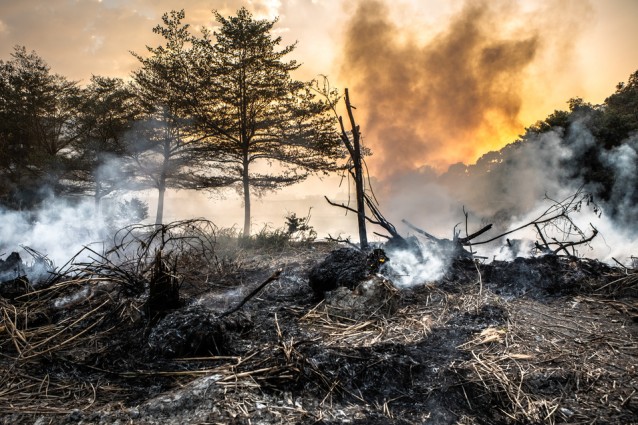
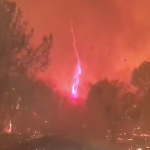
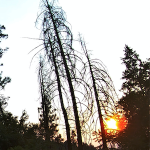
Geoengineered Forest Fire Incineration, Dark Ice, And Methane Extinction
Dane Wigington
geoengineeringwatch.org
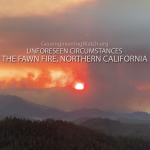
Record forest fires are raging around the globe, climate engineering is a primary factor fueling the planetary burning. All over the northern hemisphere boreal forests are going up in flames and smoke, further loading the atmosphere with Co2 and soot. This in turn triggers multiple climate feedback loops which causes much more rapid warming than what is already occuring.
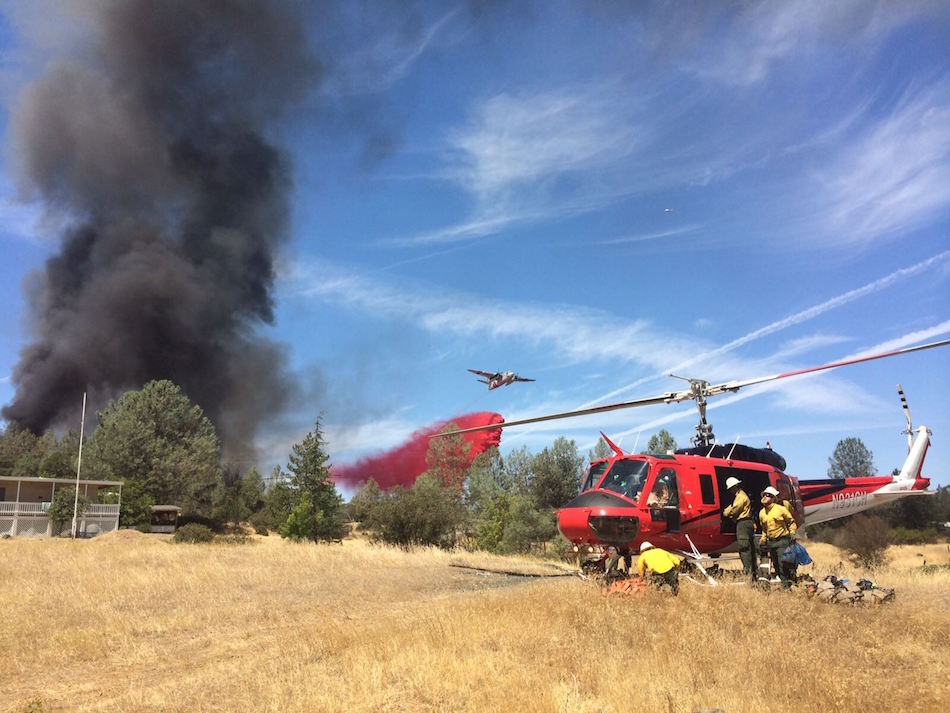
White Cloud Helibase on the Tahoe National Forest. Murphy Fire on AEU CalFire unit. Photo credit: Chester Helitack
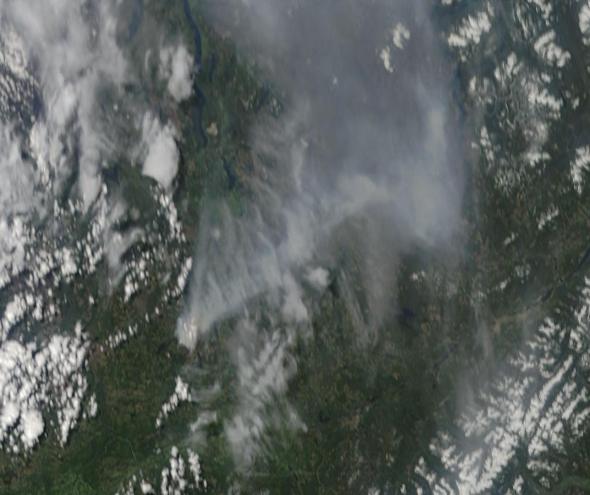
Siberian forests have been burning at a record pace in recent years. In April of 2015 the process began again. Regions in Siberia that have historically remained frozen until mid June were fully ablaze by early April.
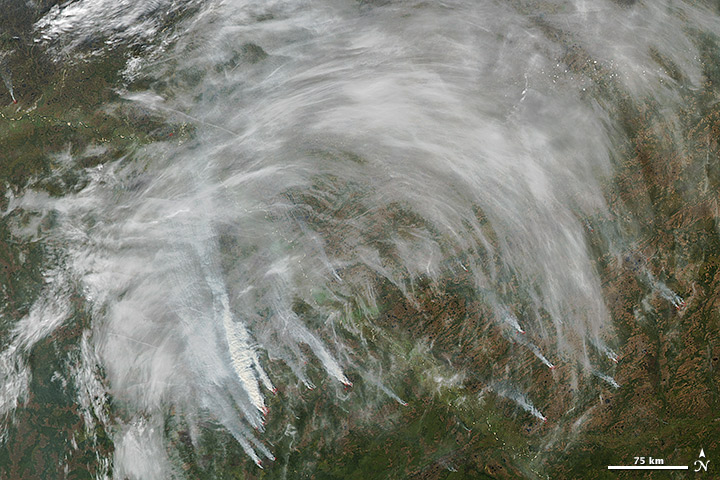
The satellite image above shows clearly that by late April, 2015, the Siberian landscape was riddled with fires.
Alaska is also being scorched after a record warm winter and record low snowfall. While the US mainstream media kept the public distracted with the "Boston snow" story during the 2014-2015 winter, Alaska was warm, dry, and setting up for the coming summer burning.
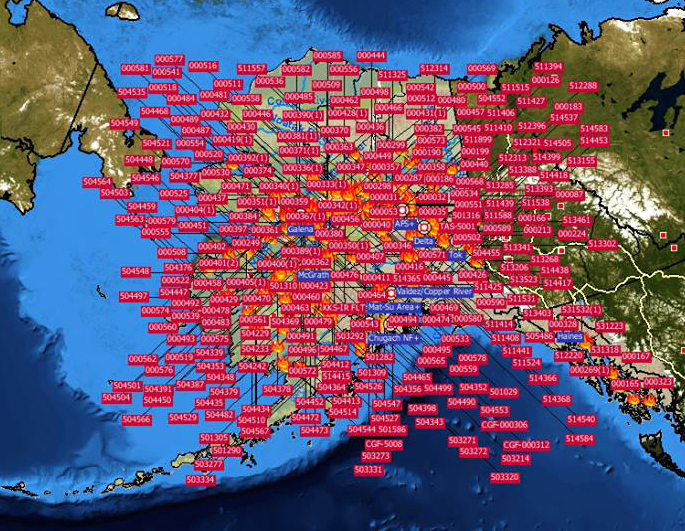
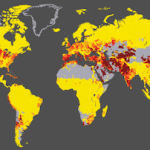
The map above reveals a staggering number of wildfires in Alaska even as summer was just beginning.

In early July there were more than 418 wildfires actively burning in Canada. By that date in 2015 there had already been more than 4,500 fires that had charred more than 2,150,000 hectares of forest. This was twice the number of fires that there were at this time last year when just over 2,200 fires burned 515,732 hectares of forest.
In the incredibly parched state of California numerous out of control fires have consumed landscapes, decimated wildlife, and destroyed many homes located in rural woodland regions. The climate engineers have been so consistent at blocking precipitation from California that one must ask the question, is California just a climate sacrifice zone, or a target of engineered drought?
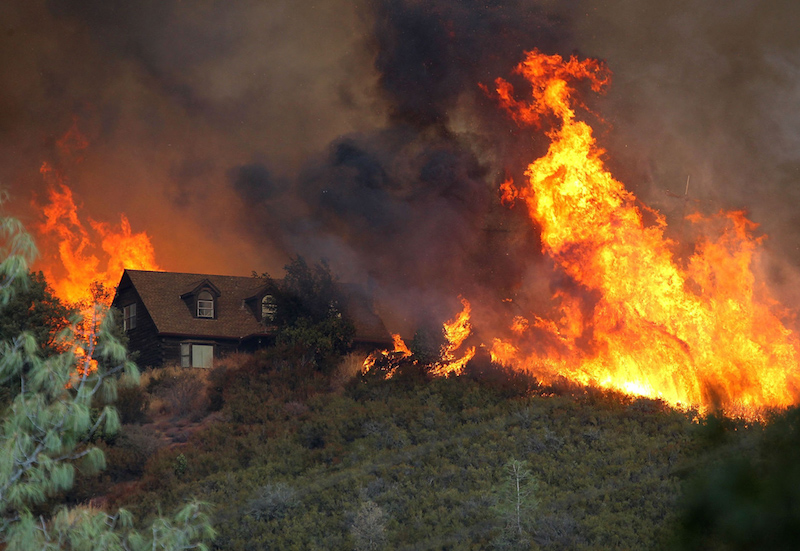
Flames from the Rocky Fire approach a house in Lower Lake, California. The fire, now contained, burned nearly 70,000 acres and destroyed 43 homes.
DW
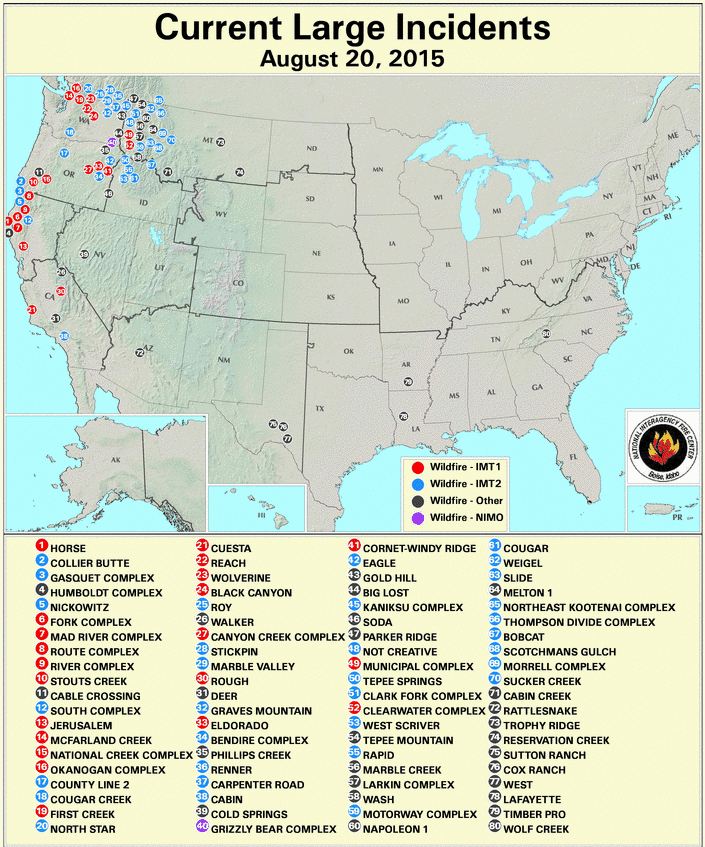
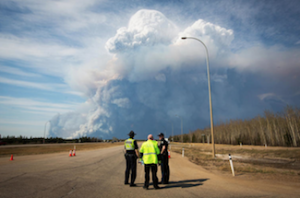
Major Arctic Fire Outbreak — Number of Active Alaskan Wildfires Doubles in Just Five Days
Source: Robert Scribbler
Late Sunday, there were 146 active wildfires burning in Alaska; as of Thursday afternoon, that number had exploded to 291.
A combination of record hot temperatures and unprecedented thunderstorm activity over the Arctic state has provided numerous dry fuels and lightning-based ignition sources over recent weeks. During the past few days, conditions rapidly worsened as an extreme fire outbreak absorbed all of the firefighting resources of Alaska and tapped a substantial portion of other states’ resources as well.
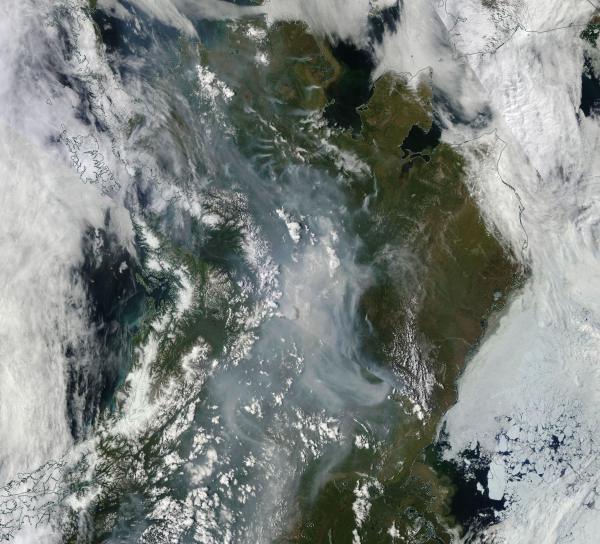
As of Wednesday afternoon, the NASA/MODIS satellite shot of Alaska (below) showed much of the massive state shrouded under vast clouds of steely gray smoke billowing up from the scores of wildfires blazing beneath. A cloud so large it is now becoming entrained in the Jet Stream and will likely blanket a large section of the Northern Hemisphere in a brown-carbon haze.
From Siberia to British Columbia Arctic Wildfires Begin an Ominous Ignition
Source: Robert Scribbler
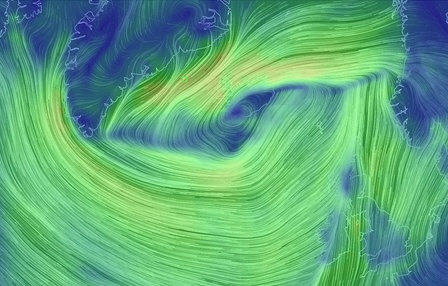
It’s abnormally warm today near Great Slave Lake, Northwest Territory. And the smell of smoke from massive fires to the west lingers in the air.
Temperatures there yesterday afternoon read 80 degrees Fahrenheit. Where I sat typing this blog in Gaithersburg, Maryland, it was a somewhat cooler 67. A north-south temperature flip-flop that has become all-too-common in recent years. A warming in the Arctic that sets the stage for gargantuan summer wildfires burning through some of the world’s greatest carbon stores. Vast and thawing permafrost deposits stretching in a great arc from Siberia through Alaska and on into Northern Canada. Immense loads of fuel for a newly forming ring of fire that is now an entirely human invention.
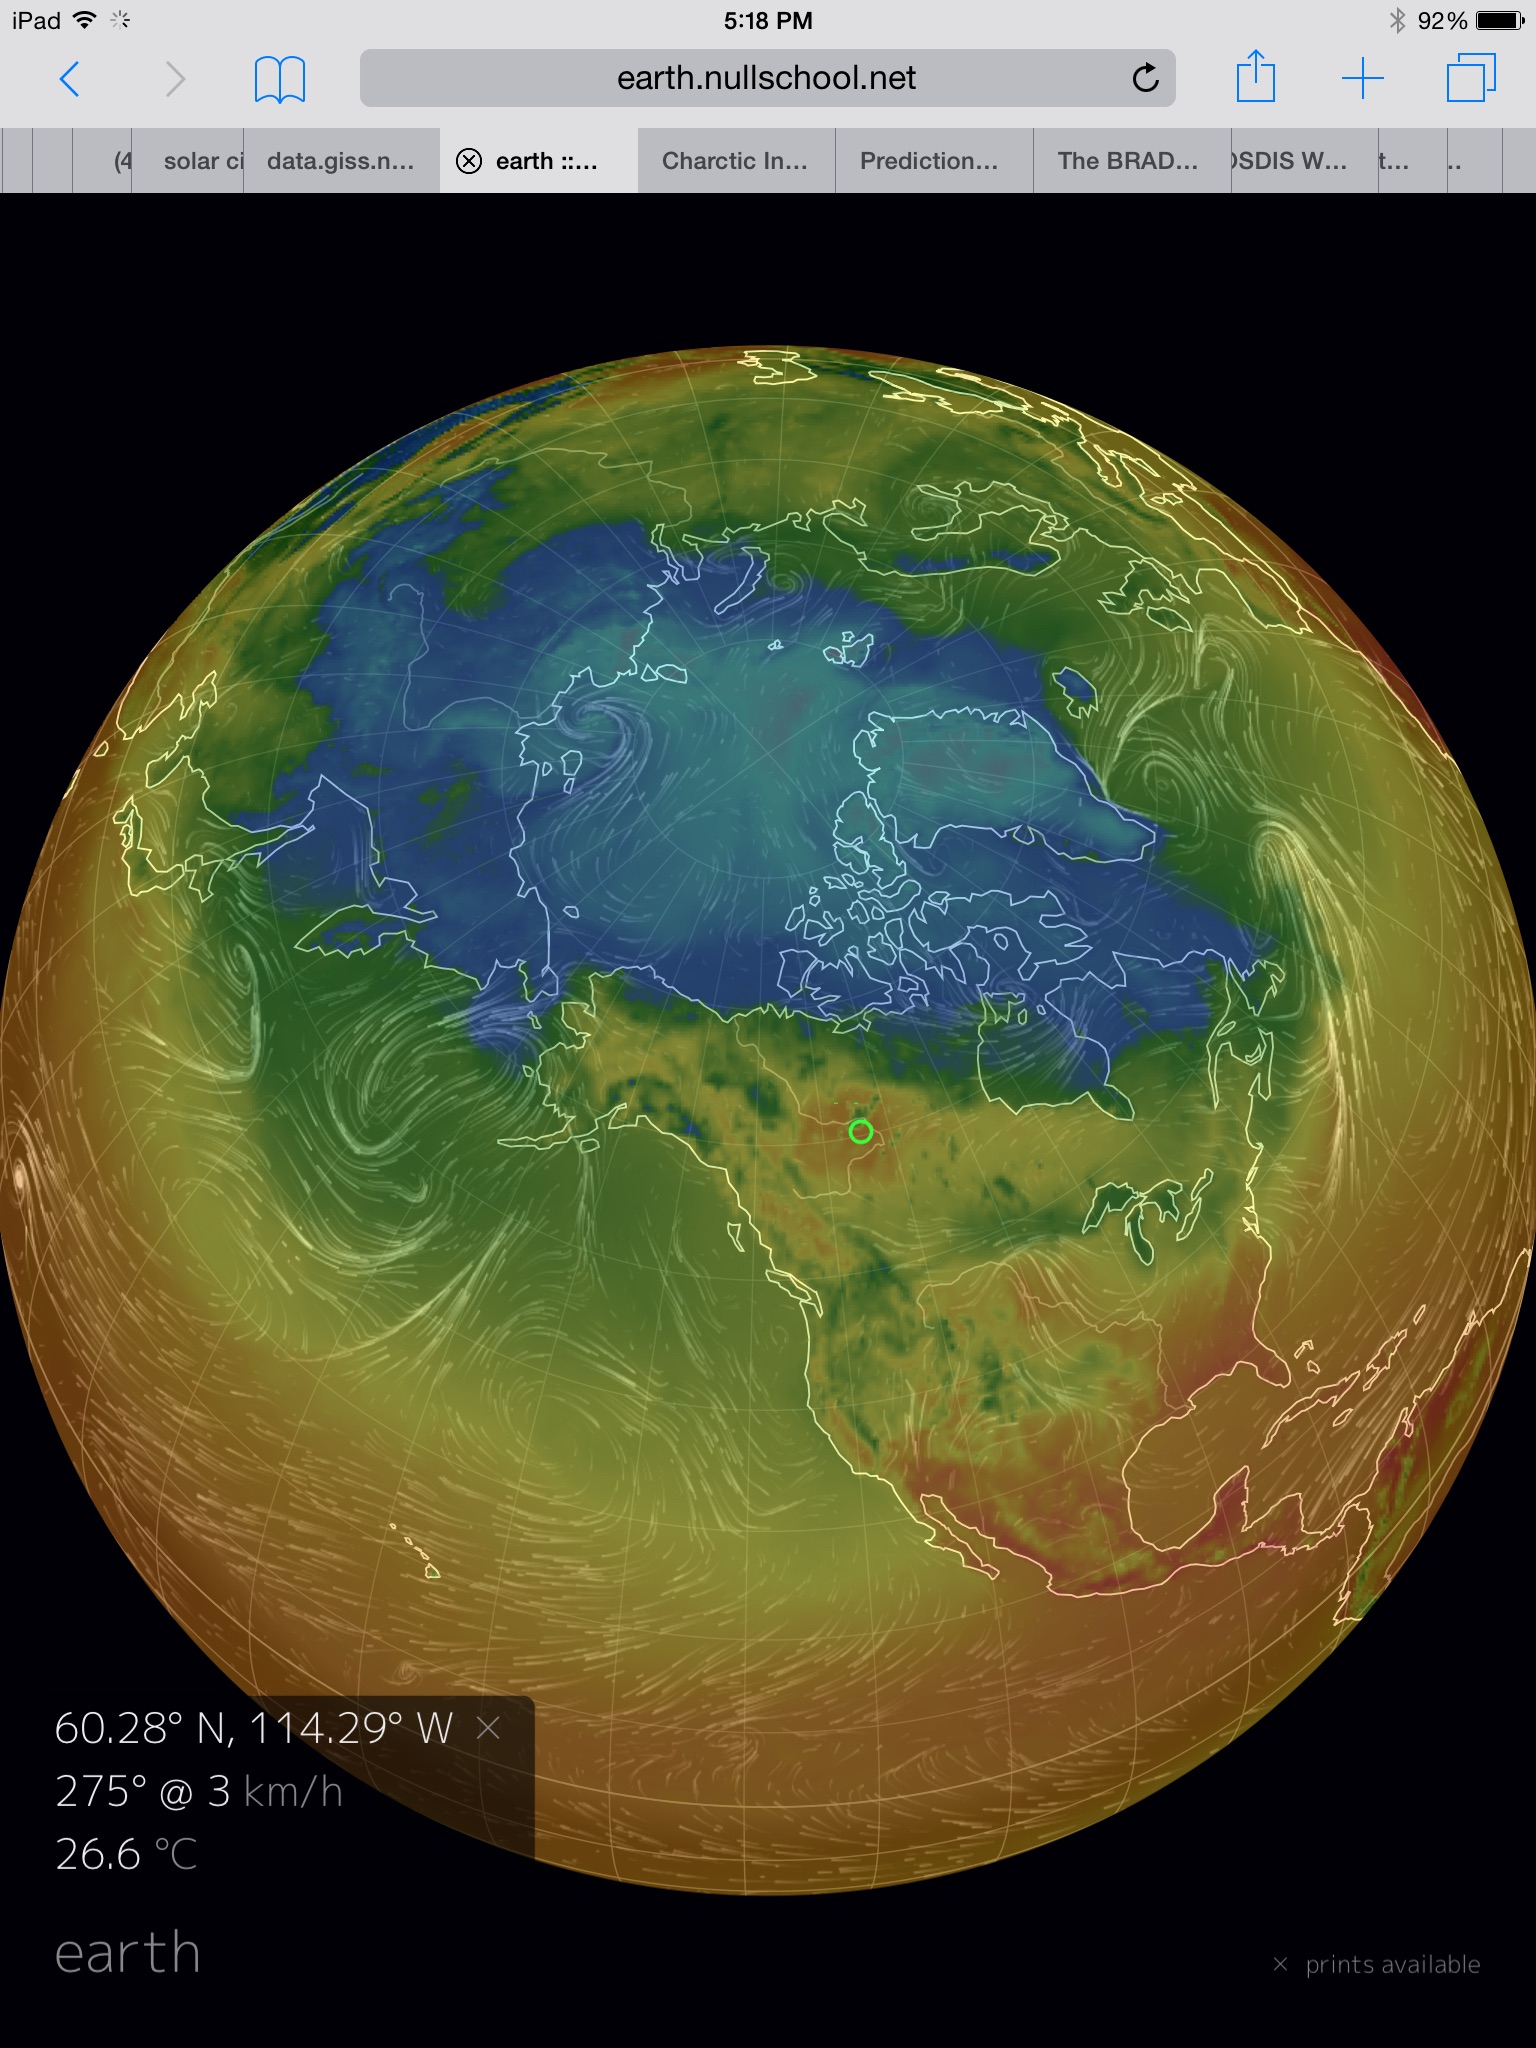
(It was pretty darn hot near Great Slave Lake, NWT territory Wednesday. 80 degree readings in a polar region that, on average, should be in the mid 40s as a daily high for May 13. Image source: Earth Nullschool.)
Sea Ice Testing New Record Lows as Heat Wave Invades Northwest Territories
Source: Robert Scribbler
For 2015, it looks as if Arctic sea ice is sitting in some rather hot water.
For from the Chukchi to the Beaufort to Hudson Bay to Baffin Bay and on into the Kara, the edge region of the Arctic Ocean is feeling a very strong melt pressure during early May of 2015. And, according to 7-10 day forecasts, that melt pressure will only intensify. As a result, we could see new record lows for Arctic sea ice extent over the next few days.
Early Melt for the Chukchi and Beaufort
Arctic warming is now particularly intense along a broad region running from coastal Alaska through to the Mackenzie Delta and on into the northwestern portion of the Canadian Archipelago. It’s an area that typically waits until at least June to melt. But, this year, sea ice recession, break-up and opening of large polynyas for this far northern area is occurring almost in tandem with melt in more southerly regions like Hudson Bay.
Antarctica May Have Just Set Its Highest Temperature On Record
Source: Mashable, written by Andrew Freedman
Antarctica, Earth's coldest, most barren continent, may have just set a remarkably unusual weather record. An Argentinian research station on the rapidly warming Antarctic Peninsula recorded a high temperature of 63.5 degrees Fahrenheit (17.5 degrees Celsius) on March 24, according to reports from Weather Underground.
If this is investigated and verified by the World Meteorological Organization (WMO), it could become the highest temperature on record for the entire continent of Antarctica.
The warmth at the Esperanza research station came one day after a nearly identical high temperature was logged at another Argentinean base, known as Base Marambio, also located along the Antarctic Peninsula. Interestingly, the mild conditions occurred during the Antarctic fall, not the height of summer.
Warm Water Rising From the Depths: Much of Antarctica Now Under Threat of Melt
Source: Robert Scribbler
Antarctica. A seemingly impregnable fortress of cold. Ice mountains rising 2,100 meters high. Circumpolar winds raging out from this mass of chill frost walling the warm air out. And a curtain of sea ice insulating the surface air and mainland ice sheets from an increasingly warm world. A world that is now on track to experience one of its hottest years on record.
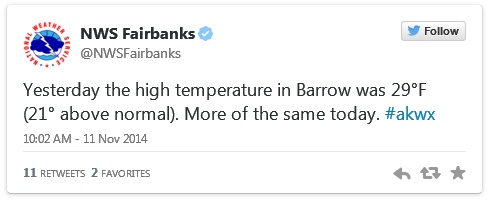
Warmer In The Arctic Than In Texas? What Is Wrong With This Picture?

It’s Warmer In Alaska Than In Texas Right Now
Source: Chron
That’s according to the National Weather Service, which reported highs in the lower 30s Fahrenheit for Barrow, AK — the northernmost city in the country — but only in forecasted highs in the low 20s for Amarillo, TX.
Record High Temperatures In The Arctic While The Eastern US Freezes
Temperatures in the Arctic as high as 50 degrees while the mercury is nearly 30 below at some locations in the Eastern US, what is wrong with this picture?
Climate engineering is tearing the biosphere’s life support systems apart. The geoengineering elephant in the room continues to wreak havoc on the planet while the entire climate science community pretends not to know a thing about the climate engineering insanity. All are needed to help sound the alarm by passing out credible data to those that still have no clue about what is going on in our skies. Start “spot fires” of awareness everywhere you can, every day counts.Taking a daily compass heading of data from multiple sources is imperative for reaching solid conclusions on exactly what is unfolding. We must all work together, everything depends on our unity in this battle. The article below does not mention climate engineering as is to be expected, but it does make clear the unprecedented conditions that are occurring.
Dane Wigington
geoengineeringwatch.org
U.S. is turning into an icebox this week. The record temps to prove it
Source: Mashable
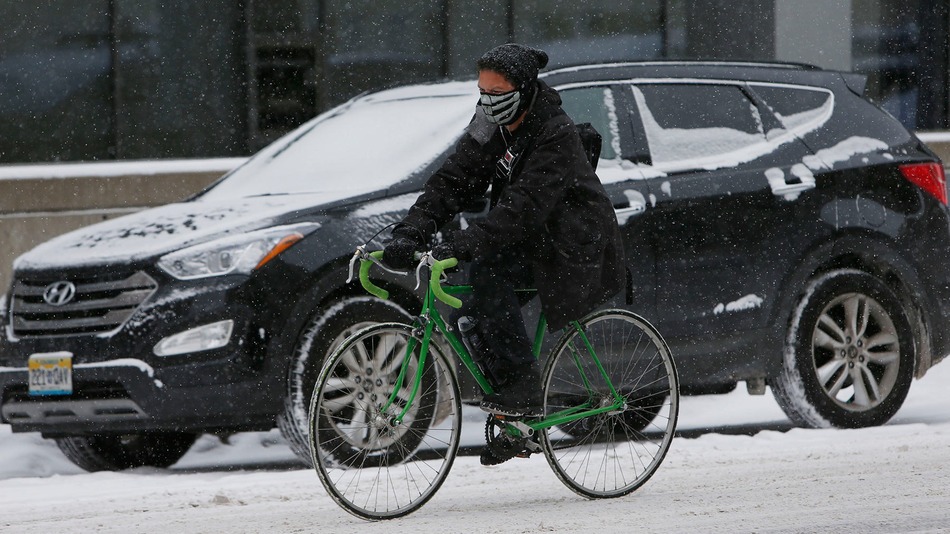
A bicyclist is bundled up to deal with the elements while riding hrough downtown Denver, Wednesday, Nov. 12, 2014.
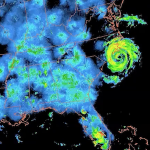
An extreme weather pattern that began with a super typhoon in the Pacific Ocean is now gripping half of the United States with record-smashing cold. Essentially, the U.S. — from the Mid-Atlantic to the Gulf Coast, northward to the Canadian border, and all the way west to Portland, Oregon — has turned into an icebox.
At the same time, record warmth has surged into Alaska and Northwest Canada, as the upper level weather highway known as the jet stream is diverted at least a thousand miles north of its usual position at this time of year, before plunging so far south over the U.S. that the air in Illinois is being sourced straight from Siberia.
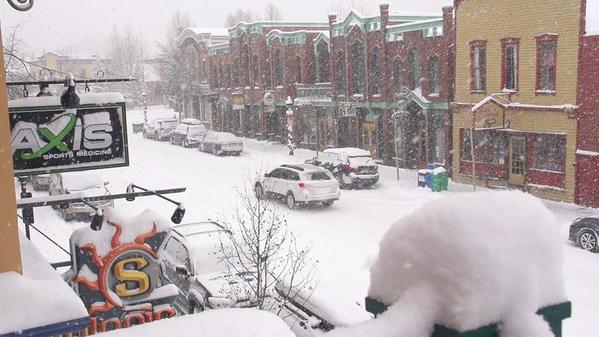
Snowy scene in Breckenridge! Two days until opening day and MORE snow is on the way.
Here are some of the most noteworthy weather records set over the past few days. We’ll see more over the course of the next week, as at least one (perhaps two) more rounds of Arctic air invade the U.S. from our neighbor to the north.
- Minus-14 degrees Fahrenheit: In Denver, the temperature dropped to minus-14 degrees Fahrenheit on Thursday morning, tying for the second coldest all-time temperature recorded there in the month of November. The last time this happened was Nov. 27, 1887; the all-time record low there is minus-18 degrees Fahrenheit, set in 1877. The high temperature at Denver International Airport only reached 6 degrees Fahrenheit on Nov. 12, a record low maximum temperature for the date, beating the old record of 9 degrees, which was set in 1916.
Robert Henson, a meteorologist at the University Corporation for Atmospheric Research in Boulder, Colo., posted on Facebook that in Denver’s recorded history of 142 Novembers, the only November days colder than Wednesday were in 1880 and 1919. Denver may see the first-ever streak of three November days with a high temperature below 20 degrees Fahrenheit, Henson added.
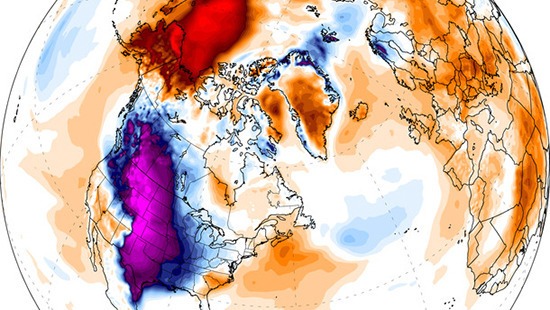
Temperature departures from average for Nov. 12, 2014, showing the unusual cold across the lower 48 states and unusually mild weather in Alaska and the Arctic.
- Minus-27 degrees Fahrenheit: In Casper, Wyoming, the extremely low temperature on Wednesday evening set a daily record low as well as a monthly low. This beat the previous monthly record low of minus-21 degrees Fahrenheit, set on Nov. 23, 1985. These temperatures are about 50 degrees Fahrenheit below average for this time of year, and cold weather of this magnitude is typically experienced there beginning in December (if at all). The earliest Wyoming had reached such a cold temperature was on Dec. 5, 1972, the National Weather Service said. Climate data there dates back to 1939.
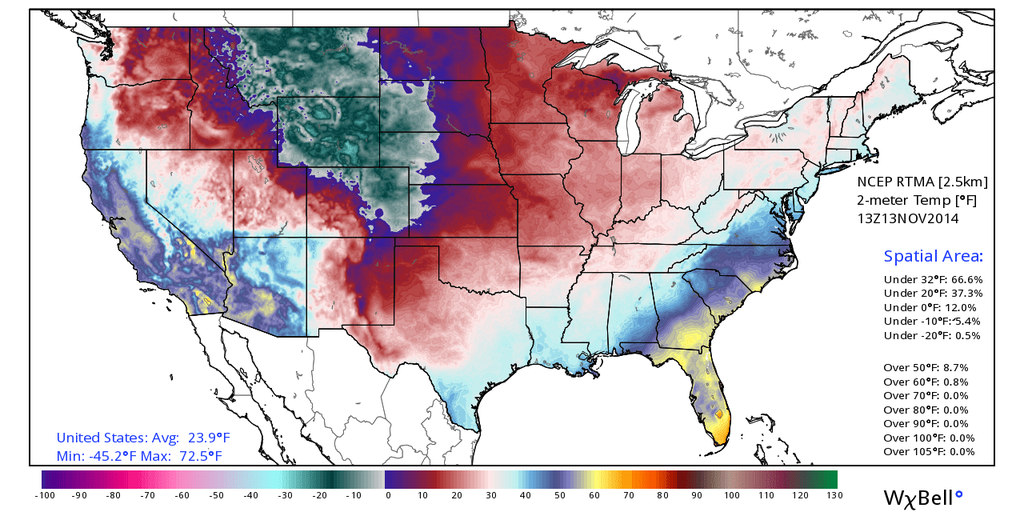
U.S. temperatures on Nov. 13, 2014, showing the core of the cold air parked over the Northwest Rockies, but spilling east and west to cover most of the country.
- Minus-21 degrees Fahrenheit: It was Livingston, Montana’s coldest temperature for so early in the season on Nov. 12. However, it has previously been much colder than this in November, with a reading of minus-31 degrees Fahrenheit on Nov. 13, 1959.
- 21 degrees Fahrenheit: On Nov. 12, Amarillo, Texas, set its coldest daily high temperature on record for so early in the season.
- 14 degrees Fahrenheit: On Nov. 12, Goodland, Kansas, set a record for the coldest daily high temperature for so early in the season.
- As the frigid airmass blows across the relatively warm waters of the Great Lakes, we’re likely going to see prodigious amounts of lake effect snow during the next week. As the Weather Prediction Center (WPC) put it in a forecast discussion on Thursday morning:
A VERY PROLONGED PERIOD OF LOCAL LAKE-EFFECT SNOWFALL EVENTS WILL PREVAIL AT VARIOUS TIMES ACROSS ALL 5 GREAT LAKES. WITH SIGNIFICANT SNOWS ALREADY PRESENT…HARD TO IMAGINE HOW MUCH MORE SNOWFALL IS POSSIBLE…PROLIFIC? NUMBERS ARE POSSIBLE. ANOMALOUS? CERTAINLY.
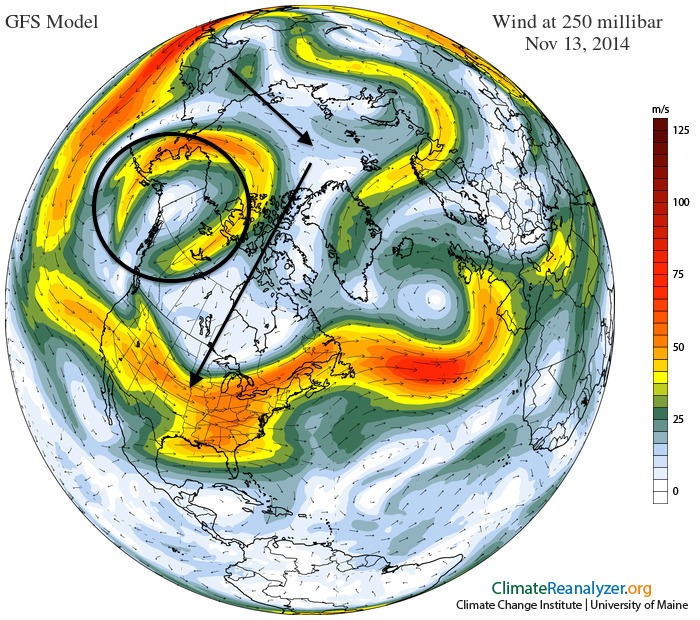
Map of the jet stream on Nov. 13, 2014, with an oval around the major dome of high pressure over Alaska, and arrows showing the frigid air being routed over the North Pole and into the lower 48 states.
The warm side of this weather pattern:
- 50 degrees Fahrenheit: A record high temperature was set in King Salmon, Alaska, on Nov. 12. This beats the old record of 48 degrees Fahrenheit in 1986. The typical high temperature in King Salmon at this time of year is 31 degrees Fahrenheit.
- At least 41 degrees Fahrenheit: On Thursday, McGrath, Alaska, had already set a daily high temperature record as of 4:49 a.m. local time, at 41 degrees Fahrenheit. The actual high temperature will climb further during the day. McGrath will likely also set a record high minimum temperature record of 38 degrees Fahrenheit, which breaks the old record of 30 degrees from 2000.
- The cold air is going to spread all the way to the West Coast as well as the Southwest U.S. with time, and it will ooze into the Southeast, including Florida, as well, according to the WPC. Some models are suggesting that a snow event may take shape along the East Coast next week, but there is a lot of uncertainty regarding that scenario.The weather pattern is leading to a classic episode of what climate scientists have labeled the “warm Arctic, cold continents” pattern, something that has been seen with increasing frequency in recent years. Studies have tied this particular pattern in part to rapid Arctic climate change as a result of manmade global warming, although this is still a subject of debate within the mainstream climate science community.
Source: Mashable
Global Extinction within one Human Lifetime as a Result of a Spreading Atmospheric Arctic Methane Heat wave and Surface Firestorm
Source: RobinWestenra @ Blogspot
Abstract
Although the sudden high rate Arctic methane increase at Svalbard in late 2010 data set applies to only a short time interval, similar sudden methane concentration peaks also occur at Barrow point and the effects of a major methane build-up has been observed using all the major scientific observation systems. Giant fountains/torches/plumes of methane entering the atmosphere up to 1 km across have been seen on the East Siberian Shelf. This methane eruption data is so consistent and aerially extensive that when combined with methane gas warming potentials, Permian extinction event temperatures and methane lifetime data it paints a frightening picture of the beginning of the now uncontrollable global warming induced destabilization of the subsea Arctic methane hydrates on the shelf and slope which started in late 2010. This process of methane release will accelerate exponentially, release huge quantities of methane into the atmosphere and lead to the demise of all life on earth before the middle of this century.
Introduction
The 1990 global atmospheric mean temperature is assumed to be 14.49 oC (Shakil, 2005; NASA, 2002; DATAWeb, 2012) which sets the 2 oC anomaly above which humanity will lose control of her ability to limit the effects of global warming on major climatic and environmental systems at 16.49 oC (IPCC, 2007). The major Permian extinction event temperature is 80 oF (26.66 oC) which is a temperature anomaly of 12.1766 oC above the 1990 global mean temperature of 14.49 oC (Wignall, 2009; Shakil, 2005).
Results of Investigation
Figure 1 shows a huge sudden atmospheric spike like increase in the concentration of atmospheric methane at Svalbard north of Norway in the Arctic reaching 2040 ppb (2.04 ppm)(ESRL/GMO, 2010 – Arctic – Methane – Emergency – Group.org). The cause of this sudden anomalous increase in the concentration of atmospheric methane at Svalbard has been seen on the East Siberian Arctic Shelf where a recent Russian – U.S. expedition has found widespread, continuous powerful methane seepages into the atmosphere from the subsea methane hydrates with the methane plumes (fountains or torches) up to 1 km across producing an atmospheric methane concentration 100 times higher than normal (Connor, 2011). Such high methane concentrations could produce local temperature anomalies of more than 50 oC at a conservative methane warming potential of 25.
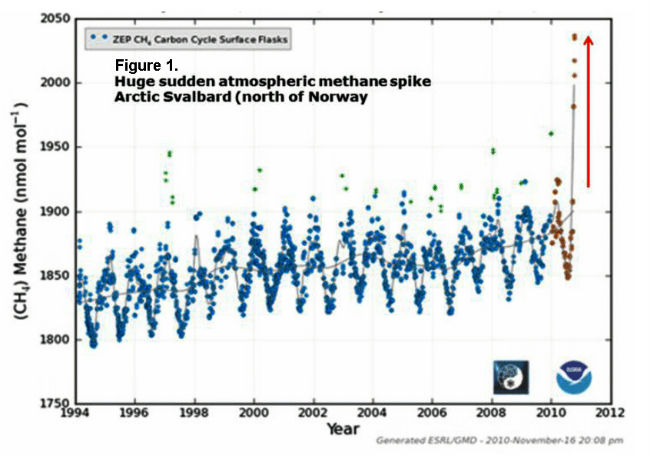
Figure 2 is derived from the Svalbard data in Figure 1 and the methane concentration data has been used to generate a Svalbard atmospheric temperature anomaly trend using a methane warming potential of 43.5 as an example. The huge sudden anomalous spike in atmospheric methane concentration in mid August, 2010 at Svalbard is clearly evident and the methane concentrations within this spike have been used to construct a series of radiating methane global warming temperature trends for the entire range of methane global warming potentials in Figure 3 from an assumed mean start temperature of -3.575 degrees Centigrade for Svalbard (see Figure 2) (Norwegian Polar Institute; 2011).
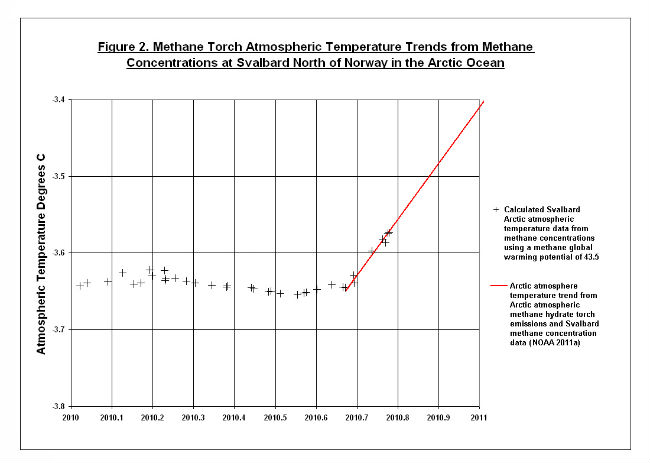
Figure 3 shows a set of radiating Arctic atmospheric methane global warming temperature trends calculated from the steep methane atmospheric concentration gradient at Svalbard in 2010 (ESRL/GMO, 2010 – Arctic-Methane-Emergency-Group.org). The range of extinction temperature anomalies above the assumed 1990 mean atmospheric temperature of 14.49 oC (Shakil, 2005) are also shown on this diagram as well as the 80 oF (26.66 oC) major Permian extinction event temperature (Wignall, 2009).
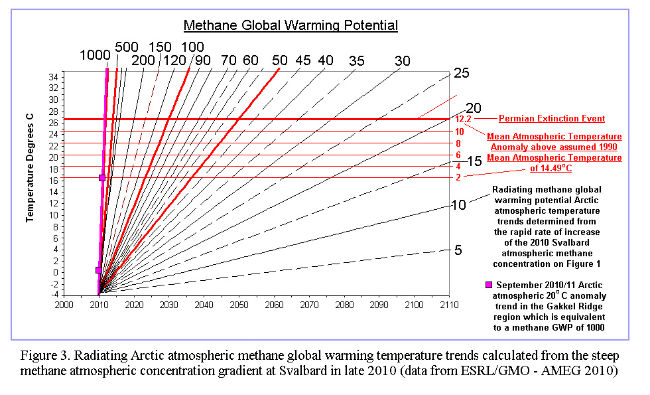
Sam Carana (pers. com. 7 Jan, 2012) has described large December 2011 (ESRL-NOAA data) warming anomalies which exceed 10 to 20 degrees centigrade and cover vast areas of the Arctic at times. In the centres of these regions, which appear to overlap the Gakkel Ridge and its bounding basins, the temperature anomalies may exceed 20 degrees centigrade. The temperature anomalies in this region of the Arctic for the period from September 8 2011 to October 7, 2011 were only about 4 degrees Centigrade above normal (Carana, pers. com. 2012). This data set can be seen on this site:- http://arctic-news.blogspot.com/p/arctic-temperatures.html
Because the Svalbard methane concentration data suggests that the major spike in methane emissions began in late 2010 it has been assumed for calculation purposes that the 2010 temperature anomalies peaked at 4 degrees Centigrade and the 2011 anomalies at 20 degrees Centigrade in the Gakkel Ridge region. The assumed 20 degree Centigrade temperature anomaly trend from 2010 to 2011 in the Gakkel Ridge region requires a methane gas warming potential of about 1000 to generate it from the Svalbard methane atmospheric concentration spike data in 2010. Such high methane warming potentials could only be active over a very short time interval (less than 5.7 months) as shown when the long methane global warming potential lifetimes data from the IPCC (2007; 1992) and Dessus, Laponte and Treut (2008 ) are used to generate a global warming potential growth curve with a methane global warming potential of 100 with a lifespan of 5 years.
Because of the high methane global warming potential (1000) of the 2011, 20 oC temperature anomalies in the Gakkel Ridge region, the entire methane global warming potential range from 5 to 1000 has been used to construct the radiating set of temperature trends shown in Figure 3. The 50, 100, 500 and 1000 methane global warming potential (GWP) trends are red and in bold. The choice of a high temperature methane peak with a global warming potential near 1000 is in fact very conservative because the 16 oC increase is assumed to occur over a year. The observed ESRL-NOAA Arctic temperature anomalies varied from 4 to 20 degrees over less than a month in 2011 (Sam Carana, pers. comm. 2012).
Figure 4 shows the estimated lifetime of a globally spreading Arctic methane atmospheric veil for different methane global warming potentials with the minimum, mean and maximum lifetimes fixed with data from Dessus, Laponche and Treut (2008) and IPCC (2007, 1992). On this diagram it is evident that the maximum methane global warming potential temperature trend of 50 intersects the 2 degree centigrade temperature anomaly line in mid 2027 at which time humanity will completely lose our ability to combat the earth atmospheric temperature rise. This diagram also indicates that methane will be an extremely active global warming agent for the first 15 years during the early stages of the extinction process. At the 80 o F (26.66 oC) Permian extinction event temperature line (Wignall, 2009), which has a 12.177 oC temperature anomaly above the 1980 mean of 14.49 oC, the lifetime of the minimum methane global warming potential veil is now some 75 years long and the temperature so high that total extinction of all life on earth will have occured by this time.
The life time from the almost instantaneous injection of methane into the atmosphere in 2010 is also shown as the two vertical violet lines (12 +- 3) years and this has been extended by 6 percent to 15.9 years to take account of increased methane concentrations in the future (IPCC, 1992b). This data set can be used to set up the likely start position for the extinction event from the large methane emissions in 2010.
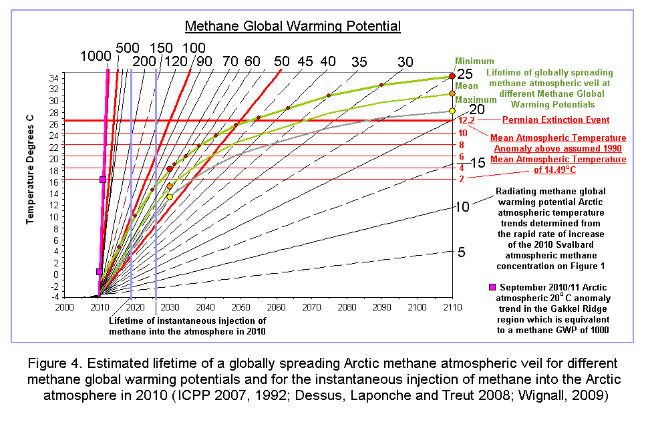
Figure 5 shows the estimated Arctic Gakkel Ridge earthquake frequency temperature increase curve (Light, 2011), the Giss Arctic mean November surface temperature increase curve (data from Carana, 2011) and the mean global temperature increase curve from IPCC (2007) long term gradient data. The corrected Arctic atmospheric temperature curve for the ice cap melt back in 2015 was derived from the mean time difference between the IPCC model ice cap and observed Arctic Ice cap rate of volume decrease (Masters, 2009). The ice cap temperature increase curve lags behind the Arctic atmosphere temperature curve because of the extra energy required for the latent heat of melting of the permafrost and Greenland ice caps (Lide and Frederickse, 1995).
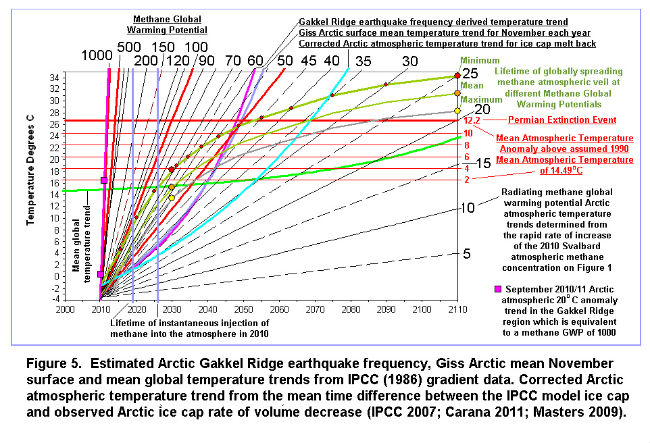
Figure 6 shows 5 mathematically and visually determined best estimates of the possible global atmospheric extinction gradients for the minimum (a), mean (b) and maximum (e) methane global warming potential lifetime trends. The mean (c) methane global warming potential lifetime trend has almost the identical gradient to the best mathematical fit over the temperature extinction interval (2 oC to 12.2 oC temperature anomaly zone) as the Arctic Gakkel Ridge frequency data (b) and the Giss Arctic mean November surface temperature data (d). This suggests that the Giss Arctic mean November surface temperature curve and the Arctic Gakkel Ridge frequency temperature curves are good estimates of the global extinction temperature gradient.
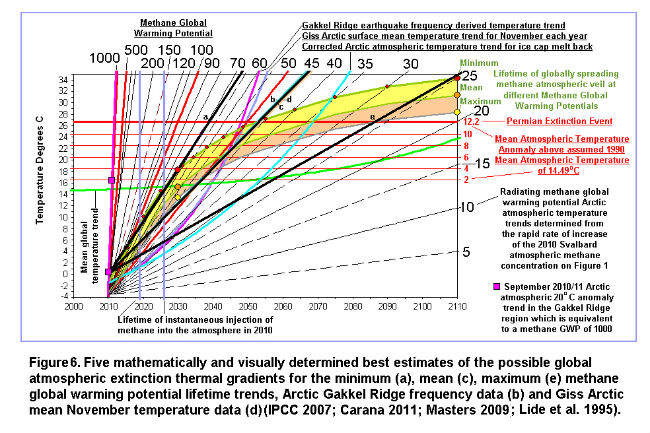
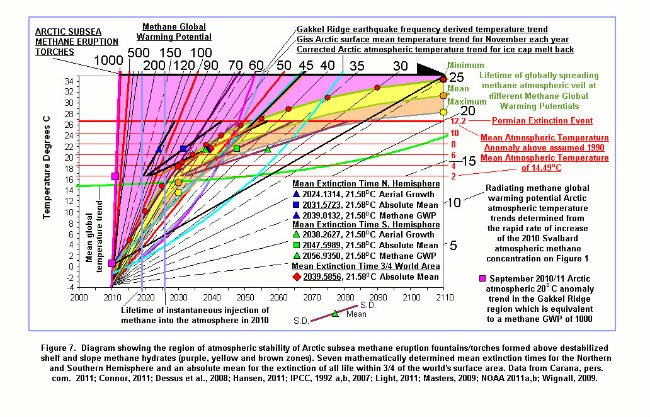
Figure 7 diagramatically shows the funnel shaped region in purple, yellow and brown of atmospheric stability of methane derived from Arctic subsea methane eruption fountains/torches formed above destabilized shelf and slope methane hydrates (Connor, 2011). The width of this zone expands exponentially from 2010 with increasing temperature to reach a lifetime of more than 75 years at 80 o F (26.66 oC) which is the estimated mean atmospheric temperature of the major Permian extinction event (Wignall 2009). The previous most catastrophic mass extinction event occured in the Permian when atmospheric methane released from methane hydrates was the primary driver of the massive mean atmospheric temperature increase to 80 oF (26.66 oC) at a time when the atmospheric carbon dioxide was less than at present (Wignall, 2009).
Method of Analysis
By combining fractional amounts of an assumed standard Arctic methane fountain/torch/plume with a global warming potential of 1000 (which equals a 16 oC temperature rise (4 – 20 oC) over one year – 2010 – 2011) with the mean global temperature curve (from IPCC 2007 – gradient data) it was possible to closely match the 5 visually and mathematically determined best estimates of the global extinction gradients shown in Figure 6 (a to e). Because the thermal radiant flux from the earth into space is a function of its area (Lide and Fredrickse, 1995) we can roughly determine how many years it will take for the methane to spread globally by getting the ratio of the determined fraction of the mean global temperature curve to the fraction of the Arctic methane fountain/torch/plume curve, as the latter is assumed to represent only one year of methane emissions. In addition as the earth’s surface area is some 5.1*10^8 square kilometres (Lide and Fredrickse, 1995) a rough estimate of the average area of the region over which the methane emissions occur within the Arctic can also be determined by multiplying the Arctic methane/torch/plume fraction by the surface area of the earth. The Arctic fountain/torch areas are expressed as the diameter of circular region of methane emissions or the two axes A and B of an ellipse shaped area of methane emissions (where B = 4A) (Table 1)
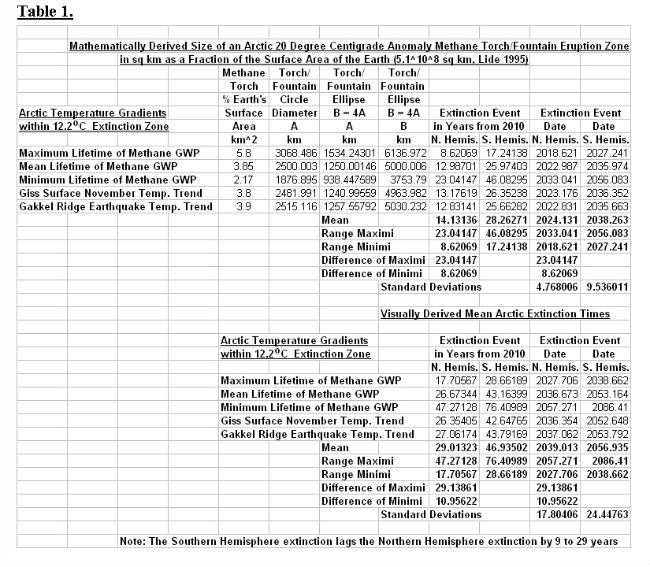
Twenty estimates have been made of the times of the various extinction events in the northern and southern hemispheres and these are shown on Table 1 and summarised on Figure 7 with their ranges. The absolute mean extinction time for the northern hemisphere is 2031.8 and for the southern hemisphere 2047.6 with a final mean extinction time for 3/4 of the earth’s surface of 2039.6 which is similar to the extinction time suggested previously from correlations between planetary orbital mechanics and the frequency increase of Great and Normal earthquake activity on Earth (Light, 2011). Extinction in the southern hemisphere lags the northern hemisphere by 9 to 29 years.
Figure 8 shows a different method of interpreting the extinction fields defined by the (12 +-3) + 6% year long lifetime of methane (IPCC, 1992) assumed to have been instantaneously injected into the Arctic atmosphere in 2010 and the lifetime of the globally spreading methane atmospheric veil at different methane global warming potentials. The start of extinction begins between 2020 and 2026.9 and extinction will be complete in the northern hemisphere by 2057. Extinction will begin around 2024 in the southern hemisphere and will be completed by 2087. Extinction in the southern hemisphere, in particular in Antarctica will be delayed by some 30 years. This makes property on the Transantarctic mountains of premium value for those people wish to survive the coming methane firestorm for a few decades longer..
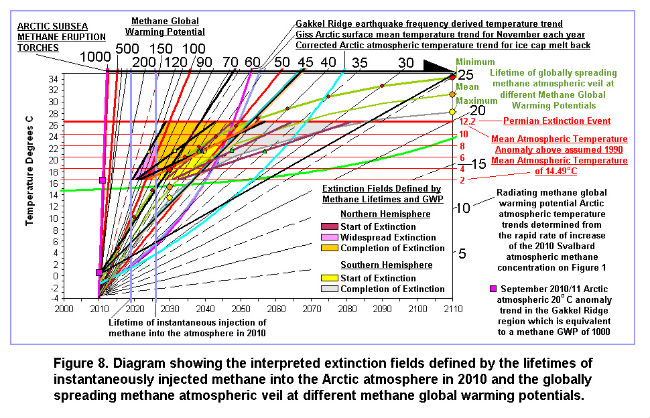
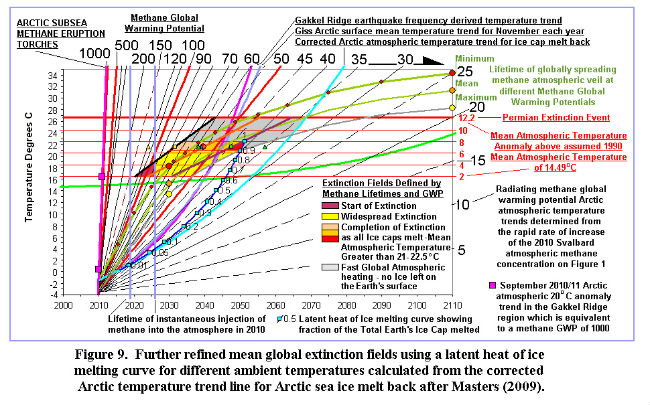
Figure 9. is a further refinement of the extinction fields shown in Figure 8. by defining a new latent heat of ice melting curve at different ambient temperatures which has been calculated from the corrected Arctic atmospheric temperature trend for the ice cap melt back defined by the difference between the Piomass observed melt back time and the IPCC modelled melt back time which predicts the melt back incorrectly some 50 years into the future (Masters, 2009). This work shows that the IPCC climate models are probably more than 100 years out in their prediction of the complete melting of the Greenland and Antarctic ice caps.
Method of Analysis
To melt 1 kg of ice you require 334 kilo Joules of energy (the latent heat of melting of ice) to transform the solid into the liquid at 0 oC (Wikipedia, 2012 ).
Subsequently for each one oC temperature rise, the water requires and additional 4.18 kilo Joules to heat it up to the ambient temperature (Wikipedia, 2012). An 80 oC temperature rise of a 1 kg mass of water requires almost exactly the same amount of energy input (334.4 kJ) as the amount of energy required by the latent heat of melting of ice (334 kJ) to covert one kg of ice into water at 0 oC. Because one Joule is the energy equivalent of the power of one watt sustained for one second there is also a time element in the melting of the ice and the heating up of the water, i.e. it is the function of temperature increase and the time similar to the way oil is generated in sediments (Lopatin, 1971; Allen and Allen, 1990).
If we consider the time necessary to melt one kg of ice and then raise its temperature to 80 oC, both of the above processes require the same amount of energy so we can consider that the first half of the time will simply involve conversion the solid ice into a liquid state at 0 oC and the second half of the time in heating the resulting ice water from 0 to 80 oC. This means that the ice melt curve at 80 oC will lag the atmospheric temperature line by half the time at 80 oC.
For temperatures less than 80 oC, the energy necessary to raise the water formed from the melted ice to the ambient temperature is less than that required for the latent melting of the ice (required to move it from a solid to a liquid state) and progressively more relative energy is needed at low temperatures to melt the ice.
The following formulation has been used to calculate the ratio of the time necessary for the melting of 1 kg of ice to water a 0 oC to the time necessary for the heating up of the 1 kg of water produced from the melted ice to the specified ambient temperature.
For any power n, let 2^n represent the ambient temperature of 1 kg of water which was derived from the melting of 1 kg of ice.
The energy required for the original melting of the 1 kg ice to water at 0 oC (latent heat of melting of ice) = 2^(n-3)/10 = 2^n/(2^3*10) = 2^n/80 = ambient temperature/80
Examples;
Let n=1; therefore temperature = 2^1 = 2 oC
Latent heat of melting = 2^(n-3)/10 = 2^-2/10 = 1/10*1/(2^2) =1/10*1/4 = 1/40
Let n=5; therefore temperature = 2^5 = 32 oC
Latent heat of melting = 2^(n-3)/10 = 2^2/10 = 4/10
The ratio of the time required for the latent heat of melting at any temperature is the reciprocal of the above = 10/(2^n-3)
The total time is therefore
a.) The time necessary for the latent heat of melting to covert 1 kg of ice into water
at 0 oC = 10/(2^n-3)
and:-
b.) The time required to heat up the 1 kg of water up to a temperature of 2^n = 1.
The total time = (10/(2^n-3)+1)
Therefore the fraction of time needed to simply melt the ice to 0 oC before it is raised to the ambient temperature 2^n = 10/(2^n-3)/((10/(2^n-3))+1)
Now: ((10/(2^n-3)) +1) = (10+ (2^n-3))/(2^(n-3))
The total time is therefore = 10/(10+(2^n-3))
Examples showing the calculation of the time ratio of the energy of latent heat of melting of ice to form water at 0 oC to the energy necessary to raise the water to the ambient temperature are shown below:-
N 2^n oC Fraction Formula Fraction
0 1 10/(10+1/8) 0.9877
1 2 10/(10+1/4) 0.9756
2 4 10/(10+1/2) 0.9526
3 8 10/(10+1) 0.9091
4 16 10/(10+2) 0.8333
5 32 10/(10+4) 0.7143
6 64 10/(10+8) 0.5555
6.32193 80 10/(10+10) 0.5000
The time value at each temperature of the corrected Arctic atmospheric temperature trend from the observed ice cap melt back (Masters, 2009) has been multiplied by the above fraction for each ambient temperature to determine a new “latent heat of ice melting curve” which represents the temperature – time energy necessary for the complete melting of the ice to water at 0 oC without the additional energy needed to raise the water to the ambient temperature of the atmosphere. This latent heat of ice melting curve is shown as the dark blue line on Figure 9.
The maximum mean global atmospheric temperature above which all the world’s icecaps will have completely melted away is estimated to lie between 7 oC and 8 oC above the mean global temperature which here is taken as 14.49 oC in 1990 (IPCC, 2007). The critical temperatures above which the Earth will entirely lose its ice caps are between 21.49 oC and 22.49 oC. It has been found however that the latent heat of ice melting curve first intersects the maximum lifetime stability line for atmospheric methane calculated from the methane global warming potentials (see. Figure 3) at the 20.964 oC extinction line (6.474 degrees centigrade above the atmospheric mean temperature of 14.49 oC in 1980) at 2050.1 and the 22.49 oCextinction line (8 oC above the atmospheric mean temperature of 14.49 oC in 1980) at 2051.3. Therefore the limits of the final melting and loss of all ice on Earth have been fixed between the 6.474 oC and 8 oC anomalies above the 1990 mean atmospheric temperature of 14.49 oC. This very narrow temperature range includes all the mathematically and visually determined extinction times and their means for the northern and southern hemispheres which were calculated quite separately (Figure 7; Table 1).
Once the world’s ice caps have completely melted away at temperatures above 22.49 oC and times later than 2051.3, the Earth’s atmosphere will heat up at an extremely fast rate to reach the Permian extinction event temperature of 80oF (26.66 oC)(Wignall, 2009) by which time all life on Earth will have been completely extinguished.
The position where the latent heat of ice melting curve intersects the 8 oC extinction line (22.49 oC) at 2051.3 represents the time when 100 percent of all the ice on the surface of the Earth will have melted. If we make this point on the latent heat of ice melting curve equal to 1 we can determine the time of melting of any fraction of the Earth’s icecaps by using the time*temperature function at each time from 2051.3 back to 2015, the time the average Arctic atmospheric temperature curve is predicted to exceed 0 oC. The process of melting 1 kg of ice and heating the produced water up to a certain temperature is a function of the sum of the latent heat of melting of ice is 334 kilo Joules/kg and the final water temperature times the 4.18 kilo Joules/Kg.K (Wikipedia, 2012). This however represents the energy required over a period of one second to melt 1 kg of ice to water and raise it to the ambient temperature. Therefore the total energy per mass of ice over a certain time period is equal to (334 +(4.18*Ambient Temperature)*time in seconds that the melted water took to reach the ambient temperature. From the fractional time*temperature values at each ambient temperature the fractional amounts of melting of the total global icecaps have been calculated and are shown on Figure 9.
The earliest calculated fractional volume of melting of the global ice caps in 2016 is 1.85*10^-3 of the total volume of global ice with an average yearly rate of ice melting of 2.557*10^-3 of the total volume of global ice. This value is remarkably similar to, but slightly less than the average rate of melting of the Arctic sea ice measured over an 18 year period of 2.7*10^-3 (1978 to 1995; 2.7% per decade – IPCC 2007).This close correlation between observed rates of Arctic ice cap and predicted rates of global ice cap melting indicates that average rates of Arctic ice cap melting between 1979 and 2015 (which represents the projected time the Arctic will lose its ice cover – Masters, 2009) will be continued during the first few years of melting of the global ice caps after the Arctic ice cover has gone in 2015 as the mean Arctic atmospheric temperature starts to climb above 0 oC. However from 2017 the rate of melting of the global ice will start to accelerate as will the atmospheric temperature until by 2049 it will be more than 9 times as fast as it was around 2015 (Table 2).
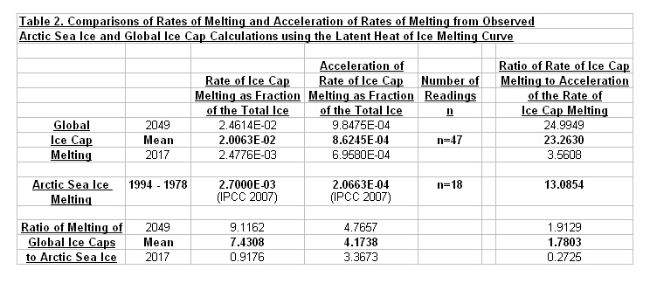
The mean rate of melting of the global icecap between 2017 and 2049 is some 2*10^-2, some 7.4 times the mean rate of melting of the Arctic ice cap (Table 2). In concert with the increase in rate of global ice cap melting between 2017 and 2049, the acceleration in the rate of melting also increases from 7*10^-4 to 9.9*10^-4 with a mean value close to 8.6*10^-4 (Table 2). The ratio of the acceleration in the rate of global ice cap melting to the Arctic ice cap melting increases from 3.4 in 2017 to 4.8 by 2049 with a mean near 4.2. This fast acceleration in the rate of global ice cap melting after 2015 compared to the Arctic sea ice cap melting before 2015 is because the mean Arctic atmospheric temperature after 2017 is spiraling upward in temperature above 0 oC adding large amounts of additional energy to the ice and causing it to melt back more quickly.
The melt back of the Arctic ice cap is a symptom of the Earth’s disease but not its cause and it is the cause that has to be dealt with if we hope to bring about a cure. Therefore a massive cut back in carbon dioxide emissions should be mandatory for all developed nations (and some developing nations as well). Total destruction of the methane in the Arctic atmosphere is also mandatory if we are to survive the effects of its now catastrophic rate of build up in the atmospheric methane concentration However cooling of the Arctic using geoengineering methods is also vitally important to reduce the effects of the ice cap melting further enhancing the already out of control destabilization of the methane hydrates on the Arctic shelf and slope.
· Developed (and some developing) countries must cut back their carbon dioxide emissions by a very large percentage (50% to 90%) by 2020 to immediately precipitate a cooling of the Earth and its crust. If this is not done the earthquake frequency and methane emissions in the Arctic will continue to grow exponentially leading to our inexorable demise between 2031 to 2051.
· Geoenginering must be used immediately as a cooling method in the Arctic to counteract the effects of the methane buildup in the short term. However these methods will lead to further pollution of the atmosphere in the long term and will not solve the earthquake induced Arctic methane buildup which is going to lead to our annihilation.
· The United States and Russia must immediately develop a net of powerful radio beat frequency transmission stations around the Arctic using the critical 13.56 MHZ beat frequency to break down the methane in the stratosphere and troposphere to nanodiamonds and hydrogen (Light 2011a) . Besides the elimination of the high global warming potential methane, the nanodiamonds may form seeds for light reflecting noctilucent clouds in the stratosphere and a light coloured energy reflecting layer when brought down to the Earth by snow and rain (Light 2011a). HAARP transmission systems are able to electronically vibrate the strong ionospheric electric current that feeds down into the polar areas and are thus the least evasive method of directly eliminating the buildup of methane in those critical regions (Light 2011a).
The warning about extinction is stark. It is remarkable that global scientists had not anticipated a giant buildup of methane in the atmosphere when it had been so clearly predicted 10 to 20 years ago and has been shown to be critically linked to extinction events in the geological record (Kennett et al. 2003). Furthermore all the experiments should have already been done to determine which geoengineering methods were the most effective in oxidising/destroying the methane in the atmosphere in case it should ever build up to a concentration where it posed a threat to humanity. Those methods need to be applied immediately if there is any faint hope of reducing the catastrophic heating effects of the fast building atmospheric methane concentration.
Malcolm Light 9th February, 2012
References
Arctic Methane Emergency Group
ameg.me
Allen, P.A., and Allen, J.R. Basin Analysis, Principles and Applications. Blackwell, Oxford, 451 pp.
Carana, S. 2011b. Light, M.P.R. and Carana, S. 2011c. – Methane linked to seismic activity in the Arctic.
http://arctic-news.blogspot.com/p/seismic-activity.html
Carana, S. 2011g. Runaway Global Warming.
http://geo-engineering.blogspot.com/2011/04/runaway-global-warming.html
Connor, S. 2011. Shock as retreat of Arctic sea ice releases deadly greenhouse gas. Russian research team astonished after finding fountains of methane bubbling to surface. The Independent.
http://www.independent.co.uk/environment/climate-change/shock-as-retreat-of arctic-sea-ice-releases-deadly-greenhouse-gas-6276134.html
DATAWeb, 2011. Combined Data Earth Policy Institute.
www.earth-policy.org/datacenter/…/update29_5x
Dessus, B., and Laponche B., Herve le Treut, 2008. Global Warming: The Significance of Methane bd-bl-hlt January 2008.
http://www.global-chance.org/IMG/pdf/CH4march2008.pdf
Hansen, J. E. 2011. GISS Surface Temperature Analysis. NASA. Goddard Institute for Space Physics. http://data.giss.nasa.gov/cgibin/gistemp/do_nmap.py?year_last=2011&month_last=08&sat=4&sst=1&type=anoms&mean_gen=02&year1=2009&year2=2009&base1=1951&base2=1980&radius=1200&pol=pol
Intergovernmental Panel on Climate Change (IPCC) 1992a. Climate Change. The IPCC Scientific Assessment (Edited by J. J. Houghton, G. J. Jenkins and J. J. Ephraums). Cambridge University Press, Cambridge. U.K.
Intergovernmental Panel on Climate Change (IPCC) 1992b. Climate Change in 1992. The Supplementary report to the IPCC Scientific Assessment (Edited by J. J. Houghton, B. A. Callander and S. K. Varney). Cambridge University Press, Cambridge. U.K.
Intergovernmental Panel on Climate Change (IPCC) 2007a. Fourth Assessment Report on Climate Change 2007. FAO 3.1, Figure 1, WG1, Chapter 3, p. 253.
http://blogs.ei.colombia.edu/wp-content/uploads/2010/12/graph-2-600X422.jpg
Intergovernmental Panel on Climate Change (IPCC) 2007b. Synthesis Report
http://www.ipcc.ch/publications_and_data/ar4/syr/en/spms1.html
Kennet, J.P., Cannariato, K.G., Hendy, I.L., Behl, R.J., 2003. Methane Hydrates in Quaternary Climate Change. The Clathrate Gun Hypothesis, Washington D.C., American Geophysical Union. ISBN 0875902960
Lide. D.R. and Frederikse H.P.R., 1995. CRC Handbook of Chemistry and Physics. 75th Edition, CRC Press, London. pp. 1-1 – 1-33.
Light M.P.R. 2011a. Use of beamed interfering radio frequency transmissions to decompose Arctic atmospheric methane clouds. Edited by Sam Carana.
http://arctic-news.blogspot.com/p/decomposing-atmospheric-methane.html
Lopatin, N.V. 1971. Temperature and geologic time as factors in coalification (in Russian). Akad. Nauk SSSR. Izvestiya. Seriya Geologicheskaya, 3, pp.95 – 106.
Masters. J. 2009. Top Climate Story of 2008. Arctic Sea Ice Loss. Dr Jeff Masters Wunderblog.
http://www.wunderground.com/blog/JeffMasters/comment.html?entrynum=1177
NASA, 2002. Global Temperature Anomalies in 0.1C. Goddard Institute for Space Studies., NASA Goddard Space Flight Center, Earth Sciences Directorate.
http://www.giss.nasa.gov/data, updated December 2002.
Norwegian Polar Institute, 2001. Svalbard, Climate:
http://www.npolar.no/en/the-arctic/svalbard/
NOAA 2011a. Huge sudden atmospheric methane spike Arctic Svalbard (north of – Norway)
http://arctic-news.blogspot.com/p/need-for-geo-engineering.html
NOAA 2011b. Huge sudden methane spike recorded at Barrow (BRW), Alaska, United States. Generated ESRL/GMO – 2011. December 14-17-21 pm
http://arctic-news.blogspot.com/p/need-for-geo-engineering.html
Rianovosti, 2011. Russian, US scientists set to study methane release in Arctic. ScienceRSS
http://en.rian.ru/science/20110902/166364635.html
Semiletov, I. 2011. Quoted from Itar-Tass. Heavy methane emissions found in the Arctic Eastern Sector. Itar-Tass. September 26, 2011.
http://www.itar-tass.com/en/c154/233799.html
Shakel M., 2005. Sustainability: Our Environment.
http://www.earthethicsinstitute.org/facultycurriculum-pdf/sustainability%20exploration20in%Mathematics.pdf
Shakova N., Semiletov, I., Salyuk, A., and Kosmach, D., 2008. Anomalies of methane in the atmosphere over the East Siberian Shelf. Is there any sign of methane leakage from shallow shelf hydrates? EGU General Assembly 2008. Geophysical Research Abstracts, 10, EGU2008-A-01526
http://meetings.copernicus.org/www.cosis.net/abstracts/EGU2008/01526/EGU2008-A-01526.pdf
Shakova, N. and Semiletov, I., 2010a. Methane release from the East Siberian Shelf and the potential for abrupt climate change. Presentation in November 30, 2010.
http://symposium2010.serdp-estcp.org/Technical-Sessions/1A
Shakova N., Semiletov, I., Leifer, I., Salyuk, A., Rekant, P., and Kosmach, D. 2010b. Geochemical and geophysical evidence of methane release over the East Siberian Arctic Shelf. Journal Geophys. Research 115, C08007
http://europa.agu.org/?view=article&uri=/journals/jc/jc1008/2009jcoo5602/2009jc005602.xml
Shakova, N., Semiletov, I., Salyuk, A., Yusupov, V., Kosmach, D., and Gustafsson, O., 2010c. Extensive methane venting to the atmosphere from sediments of the East Siberian Arctic Shelf. Science.
http://www.sciencemag.org/content/327/5970/1246.short
Wignall, P. 2009. Miracle Planet; Episode 4, Part 2. Coproduced by NHK (Japan) and the National Film Board of Canada (NFB).
http://www.youtube.com/watch?v=exfNNDExxic&list=PL0200B1S24E220C5A&feature=playerembedded#
Wikipedia., 2012. Enthalpy of Fusion.
http://en.wikipedia.org/wiki/Enthalpy_of_fusion
The following is a diagram by Sam Carana illustrating the progress

Source: RobinWestenra @ Blogspot
Changing Antarctic waters could trigger steep rise in sea levels
Source: Arc Centre of Excellence for Climate System Science
Current changes in the ocean around Antarctica are disturbingly close to conditions 14,000 years ago that new research shows may have led to the rapid melting of Antarctic ice and an abrupt 3-4 metre rise in global sea level.
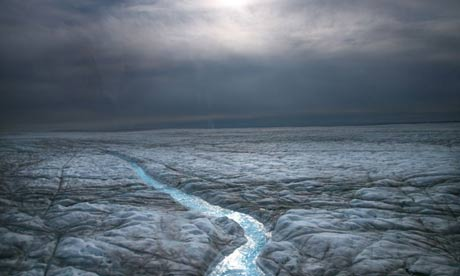
Climate Engineering And Dangerously Darkening Ice Sheets
Are there connections between the out of control global geoengineering programs and the rapidly blackening heat absorbing ice packs? The connections are stark and undeniable. Climate engineering programs are rapidly accelerating humanity’s descent toward total extinction. What part has six plus decades of weather modification insanity played in the now unfolding cataclysms? Simply stated, climate engineering has completely derailed Earth’s attempt to respond to anthropogenic effects and damage to the climate system. The ongoing atmospheric manipulation has totally disrupted the planetary hydrological cycle, shredded the ozone layer, and contaminated air, soils and waters around the globe. All of this has contributed radically to the off the chart increase in forest fire frequency and intensity. This in turn has added massive amounts of soot to the atmosphere. As the soot settles back down to Earth it is blackening the surface of glaciers and ice sheets, another climate feedback loop is spawned. Exposing and halting the global climate engineering programs is the greatest leap we could collectively make in the right direction. Make every day count in this fight, this battle will take all of us.
Dane Wigington
geoengineeringwatch.org
Warm water flowing into Arctic Ocean
Source: Arctic News
For the first time in thousands of years, warm water is flowing into the Arctic Ocean. Warm water from the deep ocean is showing up on surface images. There is no way to put this into the context of ‘normal.’ Historic temperatures have kept the Arctic frozen on an even keel for thousands of years. Even if there was a ‘natural cycle’ it has been completely overridden by the astonishing amount of pollution that is going into the atmosphere.

Historic Wildfires Burn Through Canada As Sub-Arctic Forests Heat Up
Source: Climate Progress
Wildfires are taking off in Canada as the country goes through one of its hottest and driest summers in decades.
Arctic thaw — carry on regardless?
Source: Alaska Dispatch News
When a colleague who has a lot of sympathy for those who do NOT accept that humans are responsible for global warming drew attention to the fact that this had been the hottest June on record, following hard on the hottest May, I must admit I was temporarily put of my guard.
Changing Antarctic winds create new sea level threat
Source: Science Daily
New research shows projected changes in the winds circling the Antarctic may accelerate global sea level rise significantly more than previously estimated.
Storms will wreak havoc in the Arctic with probability of Methane Hydrates being released abruptly
Source: Daily KOS
We know that some things are adapting to a warmer climate by migrating north. Some of these species include the Mangrove forest, butterflies, fish, mosquitos and many others. NOAA has added a terrifying new entry to this list, the latitude where hurricanes, typhoons, and cyclones reach their maximum intensity.
Arctic Ocean Temperatures Continue to Skyrocket
The mercury continues to rice all over the globe, there will be no hiding the meltdown for much longer. In the meantime, the completely insane and out of control climate engineering programs continue to make an already extremely bad situation far worse still
Dane Wigington
geoengineeringwatch.org
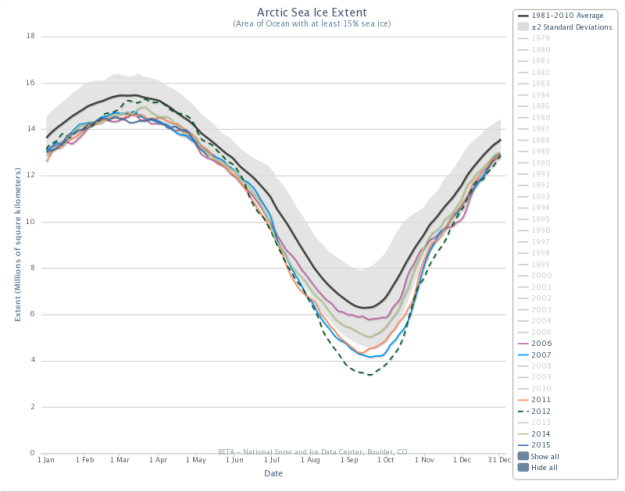
Outlook for Sea Ice Remains Bleak
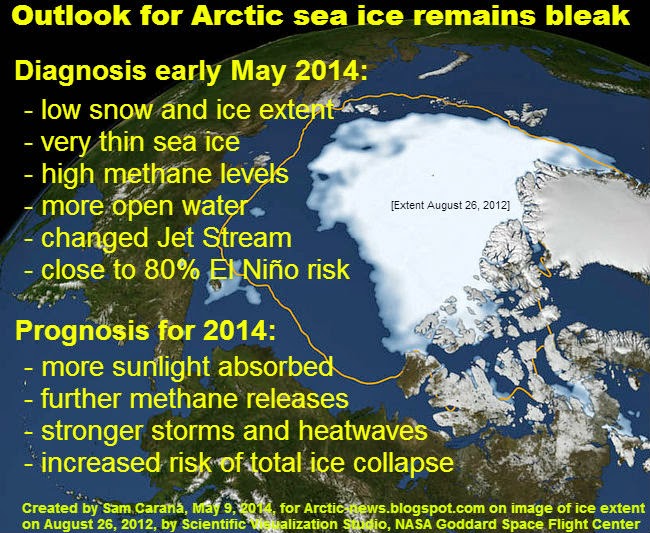
In April 2014, Arctic sea ice reached its annual maximum volume. It was the second lowest on record, according to calculations by the Pan-Arctic Ice Ocean Modeling and Assimilation System (PIOMAS) at the Polar Science Center. The ice volume in March 2014 also was the second lowest on record, as discussed in an earlier post. The fall in volume over the years is illustrated in the graph below, by Wipneus.
Arctic Heatwave Goes Unreported By US Media
Antarctic glaciers melting 77% faster than 40 years ago: Sea levels will rise by FOUR FOOT if they collapse completely
- Study looked at six of the fastest flowing glaciers in Antarctica
- They are collectively shedding ice 77% faster than they were in 1973
- Now shed the same amount of ice as the entire Greenland ice sheet
- Ice from these glaciers accounts for 10% of the annual sea-level rise
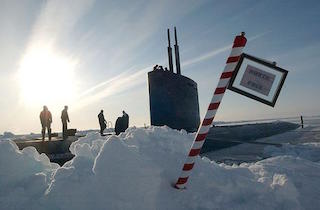
Melting Arctic Opens New Frontier, Challenges
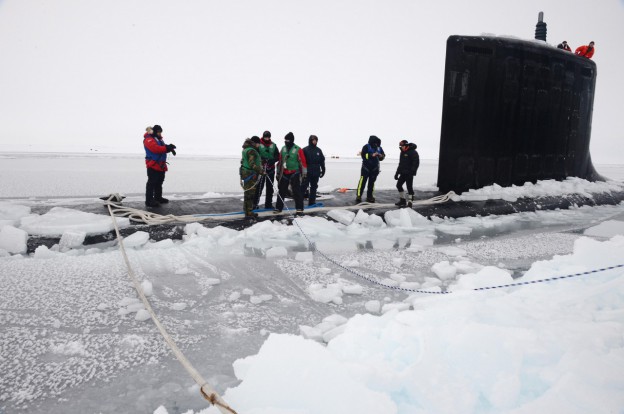
In this Saturday, March 22, 2014 photo provided by the U.S. Navy, sailors aboard the Virginia-class attack submarine USS New Mexico tie mooring lines after the submarine surfaces through the arctic ice at Ice Camp Nautilus, north of Alaska. Cracks in polar sea ice are prompting the Navy to break down the camp that provided support for an exercise involving submarines. (U.S. Navy via AP)
Feedbacks in the Arctic
This is more a climate report than a weather report; yet, the extreme weather that did hit the U.K. recently and that is forecast to hit large parts of North America next week may make more people realize that action is needed now. So, please share!


